Category Archives: Uncategorized

#PGHanalytics slides and video

Thanks to everyone who attended the 2014 Pittsburgh Hockey Analytics workshop! We’d also like to thank you for the donations which easily covered our financial outlay for the workshop and helped pay for some of our server costs over the past few months.

Here is a complete list of all available presentation slides.

Video:

Slides:

Make your own NHL rink plot in R

We had to construct our own image of an NHL rink for Hextally and other applications. Partly this is so we can superimpose our own images on top of it using NHL shot location data; partly this is because the images online — including on the NHL website! — are out of date, particularly in the corners.

So we rigged up the code necessary to reproduce it on command. Below is the thumbnail for the image; click on it to resolve the full image at 860×2050 pixels. See after the jump to reproduce it directly (though it will be vertically aligned). Update: New 5’7″ hash marks are now in the image and the code.

full-rink


Continue reading

Adjusted Save Percentage: Taking into Account High, Medium, and Low Probability Shots

When we demonstrated the goalie statistics and goalie history pages, we omitted precise definitions of some of the statistics offered on these pages. In particular, statistics like “Adjusted Save%”, “Save% High”, “Save% Med”, and “Save% Low” are new to the #fancystats literature, and deserve their own definitions.

To start, note that we provide definitions for each of these metrics on our Glossary page. We encourage readers to read our definitions of AdjustedSavePct, SvPctHigh, ScPctMed, and SvPctLow before reading any further.

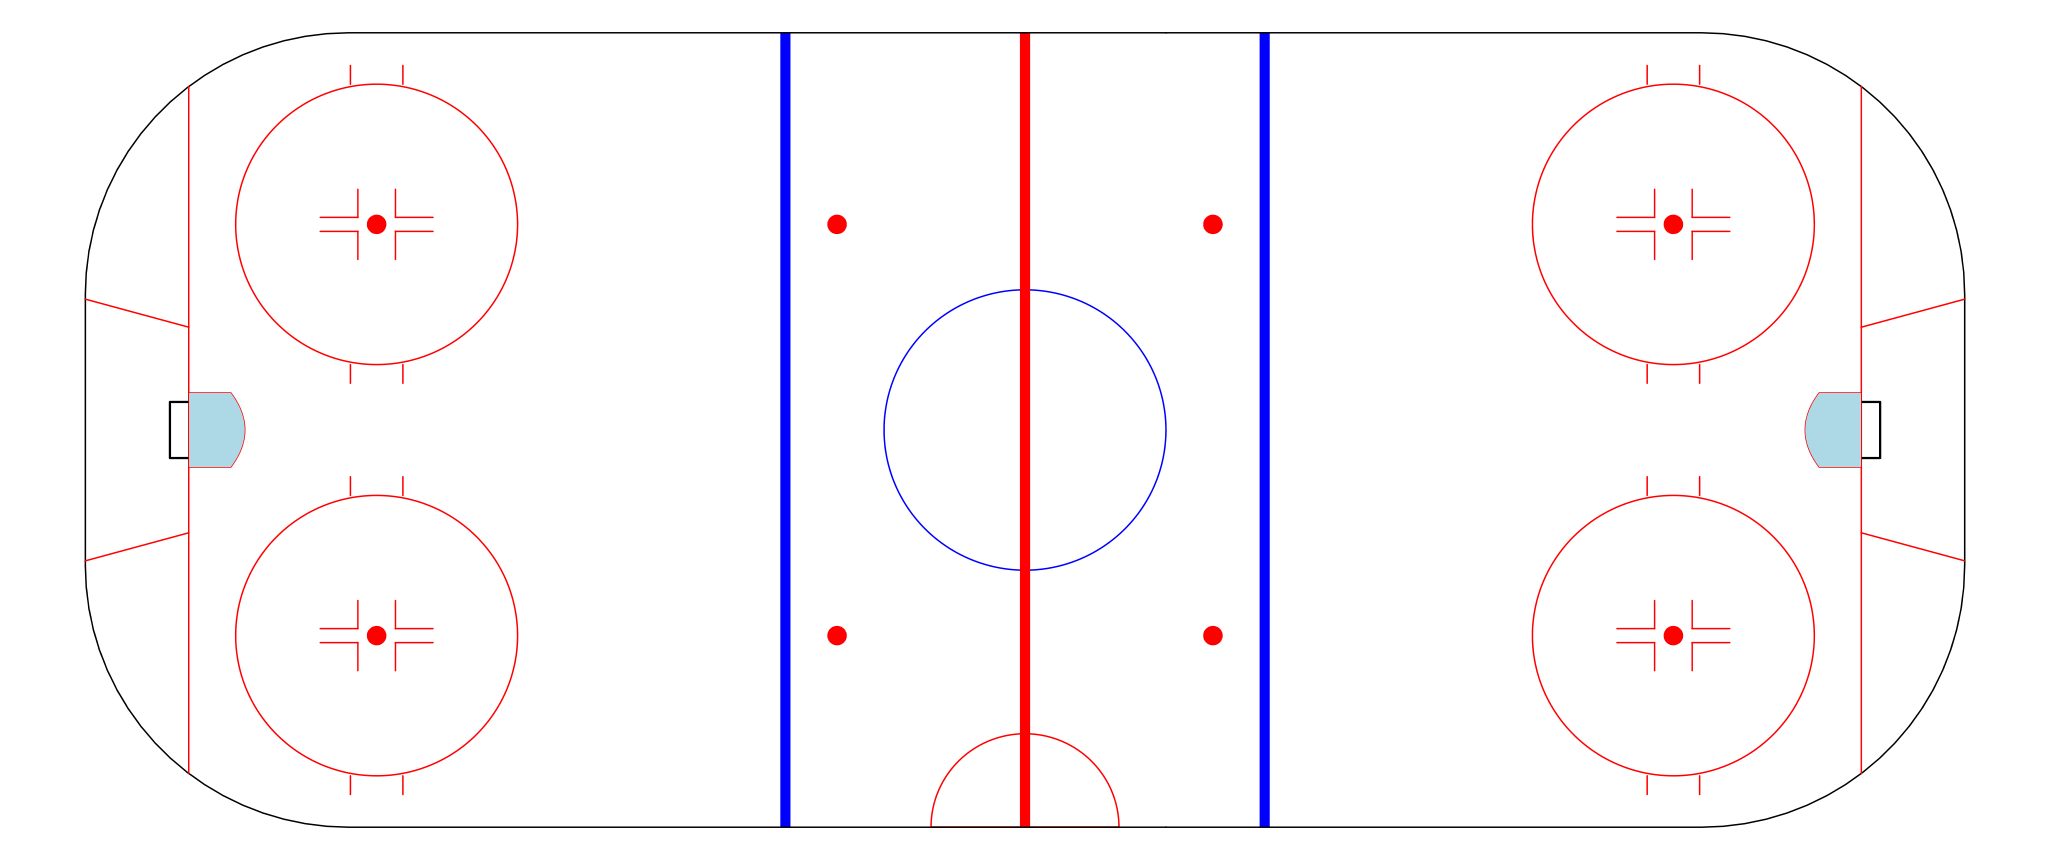
Also, don’t forget to check out this graphic from our Glossary page, which we’ll reference later in this post:

zones-three

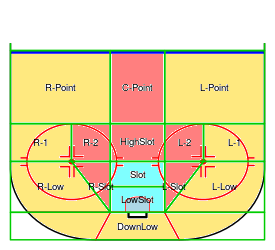
Save Percentage Zones:

blue = high percentage shots (SvPctHigh)
red = medium percentage shots (SvPctMedium)
yellow = low-percentage shots (SvPctLow)


Adjusted Save Percentage:  Partitioning the Offensive Zone into Three Scoring Areas

NHL goaltenders do not compete on a level playing field:  In any given game, some goaltenders face many difficult, close-range shots, while others face many easy, long-range shots.  To account for this, we use “Adjusted Save Percentage”, which takes into account the “quality” of each shot they face based on the empirical league-wide shooting percentage from that area of the ice.

To do this, we used @acthomasca‘s Hextally, which partitions the offensive zone into 15 areas (see graphic above).  When doing this, we found that there are three areas with similar empirical Fenwick shooting percentages since the 2008-09 season:

Untitled

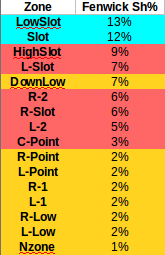
As such, we defined the following three (Fenwick) shooting percentage areas:  High probability (10% and above; blue), Medium probability (3.1% to 10%; red), and Low probability (3.0% and below; yellow). We include “DownLow” in the low-probability area because shots from this area are very rare and missed shots likely to be unreported.

We should also note that we tried Rob Vollman’s “home plate” zone, but found that parts of “home plate” (e.g. our “slot” and “low slot”) had about double the Fenwick shooting percentages as other parts of “home plate” (e.g. R-2, L-2, R-Slot, L-Slot).  In fact, Vollman’s “home plate” is just a combination of our medium and high probability zones (minus our “C-Point”). While it’s an excellent tool for scoring by hand, the precision of the data from the NHL allows us to refine these estimates further.

Finally, since having memorable names is important in hockey analytics, we propose such a scheme:

  • High probability area (blue):  “The Box”
  • Medium probability area (red):  “The Wrench”
  • Low probability area (yellow):  “The Perimeter”

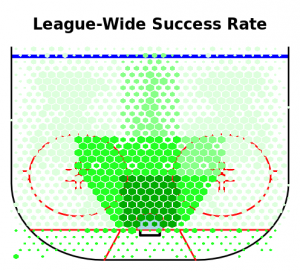
Here’s a plot of the league-wide Fenwick shooting percentages each of the original 15 areas from Hextally (colored by Fenwick shooting percentage).  See the clear three-zone distinction?

league-wide-success-rates


Back to Our Goalie Statistics:

Because of the empirical differences in shooting percentages across these three zones, we chose to evaluate goalie save percentages separately for each of these zones.  For this reason, we list “SvPctHigh”, “SvPctMed”, and “SvPctLow” on our site.

Finally, since we still needed an all-in-one metric to summarize a goalie’s save percentage, we created “Adjusted Save%”.  Adjusted Save% works similarly to Stephen Burtch’s dCorsi, in that it controls for factors that are outside of the player’s control.  Burtch’s dCorsi controls for things like zone starts, quality of teammates, and quality of competition; adjusted save% controls for the number of shots a goalie faces from each one of the three shooting percentage zones. As such, goalies who face more high-percentage shots than average are not punished, and goalies who face more low-percentage shots than average are not rewarded, since these are (for the most part) out of their control. The exact derivation is the “benchmarked” save percentage, by correcting for the rates at which these shots occur league wide:

Adjusted Save Percentage = (SvPctLow * (All Low Shots) + SvPctMed * (All Med Shots) + SvPctHigh * (All High Shots))/(All Low Shots + All Med Shots + All High Shots)

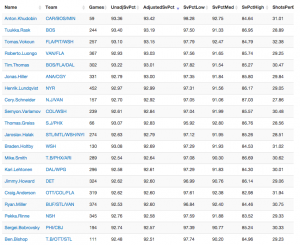
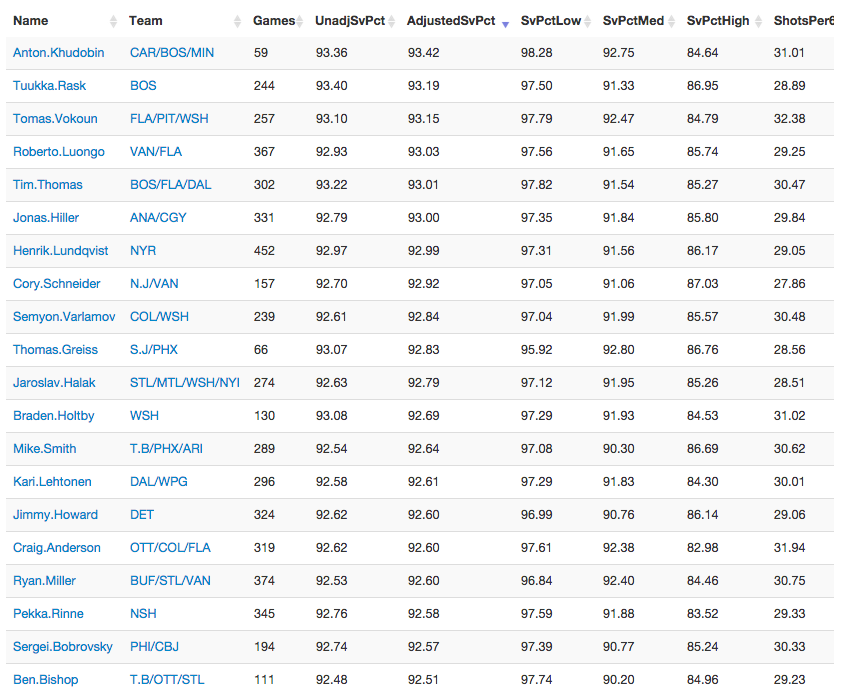
The table below shows the even-strength adjusted save percentage leaders for all NHL goalies since the 2008-09 season.

adj-sv-pct-leaders

The Great Data Debate of Oct 22

Because this is what Hockey Twitter is for: finding little discrepancies. Leading off a @Mirtle quote on Dion Phaneuf’s Corsi For Percent, we noticed a discrepancy in raw counts between our site and Hockey Analysis, which only got weirder when we compared to HockeyStats.ca and NaturalStatTrick as well — no one seemed to agree completely.

Here’s what I found, going through the numbers with tweezers, particularly the game between TOR and NYI last night and in further conversation:

1) HockeyAnalysis uses the shift charts to determine who was on the ice; the rest of us do it from the On-Ice players in the PL play-by-play file. There are discrepancies between the two, which I wish I understood better, and there’s no good way to know which to trust first.

2) HA and we consider all events with an empty net to be separate from standard 5v5, which the others do not. For example, we have Dion Phaneuf with SF/SA 4/4 for the TOR/NYI game, whereas HockeyStats.ca and NaturalStatTrick have him at 4/5 — the difference is a pre-penalty shot at 15:39 of the 3rd period.

So, one minor mystery solved. Many more to go!

nhlscrapr 1.8 — a minor working update

We’ve updated nhlscrapr, our package that does what it’s in the name, to version 1.8. What this does is reprocess several of the html files from nhl.com into R readable tables. We do this with the *strong* caveat that we’re using this for academic purposes and that anyone using the package should be aware of their own actions when doing so.

This is actually a minor upgrade only with two purposes:

  • Games from the 2014-2015 season can now be retrieved, and by specifying ‘season=”20142015″‘ you can download only that season, or selected seasons, without more complex operation.
  • To respect NHL server capacity, we instituted a wait of 20 seconds between downloading individual games.

For now, we took out many of the other data correction aspects — adjusted distance and zone-location correction — that will be enhanced when version 2.0 is released which are still in progress.


How To Use Our “Goalie History” Page

This is part of a series of “how to” posts about the site.  In this series, we hope to describe and demonstrate how to use all of the features on war-on-ice.com.  As always, if you have any comments, questions, or feedback, please reach out to us on Twitter.  

Introduction:  The Goaltender History page is very similar to the Goaltender Statistics page (which we described here).  The key difference is that the goalie history page shows all traditional and modern statistics for an individual goalie over the course of their career.  As such, it can be thought of as a “career statistics” page for goalies.

The page is accessible by clicking the “Goaltender History” link in the “Players” tab:

skater-stats-dropdown

The goalie history page has two main sections:  By Season and By Game.  Each of these sections has its own tab and contains a sortable table and a customizable visualization tool.

Continue reading

How To Use Our “Goaltender Statistics” Page

This is part of a series of “how to” posts about the site.  In this series, we hope to describe and demonstrate how to use all of the features on war-on-ice.com.  As always, if you have any comments, questions, or feedback, please reach out to us on Twitter.  

Introduction:  The Goaltender Statistics page shows all traditional and modern statistics for all NHL goalies in a particular season or time frame.  The page is accessible by clicking the “Goaltender Statistics” link in the “Players” tab:

skater-stats-dropdown

The goalie statistics page contains a sortable table and a customizable visualization tool.

Continue reading

How To Use Our “Skater History” Page

This is part of a series of “how to” posts about the site.  In this series, we hope to describe and demonstrate how to use all of the features on war-on-ice.com.  As always, if you have any comments, questions, or feedback, please reach out to us on Twitter.  

Introduction:  The Skater History page is almost identical to the the Skater Statistics page.  The key difference is that the skater history page shows all traditional and modern statistics for an individual player over the course of their career.  As such, it can be thought of as a player’s “career statistics” page.

Like the skater statistics page, the skater history page is accessible by clicking the “Skater History” link in the “Players” tab:

skater-stats-dropdown

The skater history page has two main sections:  By Season and By Game.  Each of these sections has its own tab and contains a sortable table and a customizable visualization tool.

Continue reading

How To Use Our “Skater Statistics” Page

This is the first in a series of “how to” posts about the site.  In this series, we hope to describe and demonstrate how to use all of the features on war-on-ice.com.  As always, if you have any comments, questions, or feedback, please reach out to us on Twitter.  

Warning:  Since this is the first “how to” post, it is a bit long.  Future posts will be much shorter.


Introduction:  The skater statistics page was the first page we developed for WAR On Ice, and it contains the bulk of the statistical content for forwards and defensemen on the site.  The page is divided into two main sections:

  1. Table:  A searchable, sortable, downloadable table of traditional and modern metrics for all NHL forwards and defensemen since 2002
  2. Plot:  A customizable graphing tool for visualizing traditional and modern metrics for all NHL forwards and defensemen since 2002

The page is always accessible from the “Skater Statistics” link in the “Players” tab:

skater-stats-dropdown

Continue reading