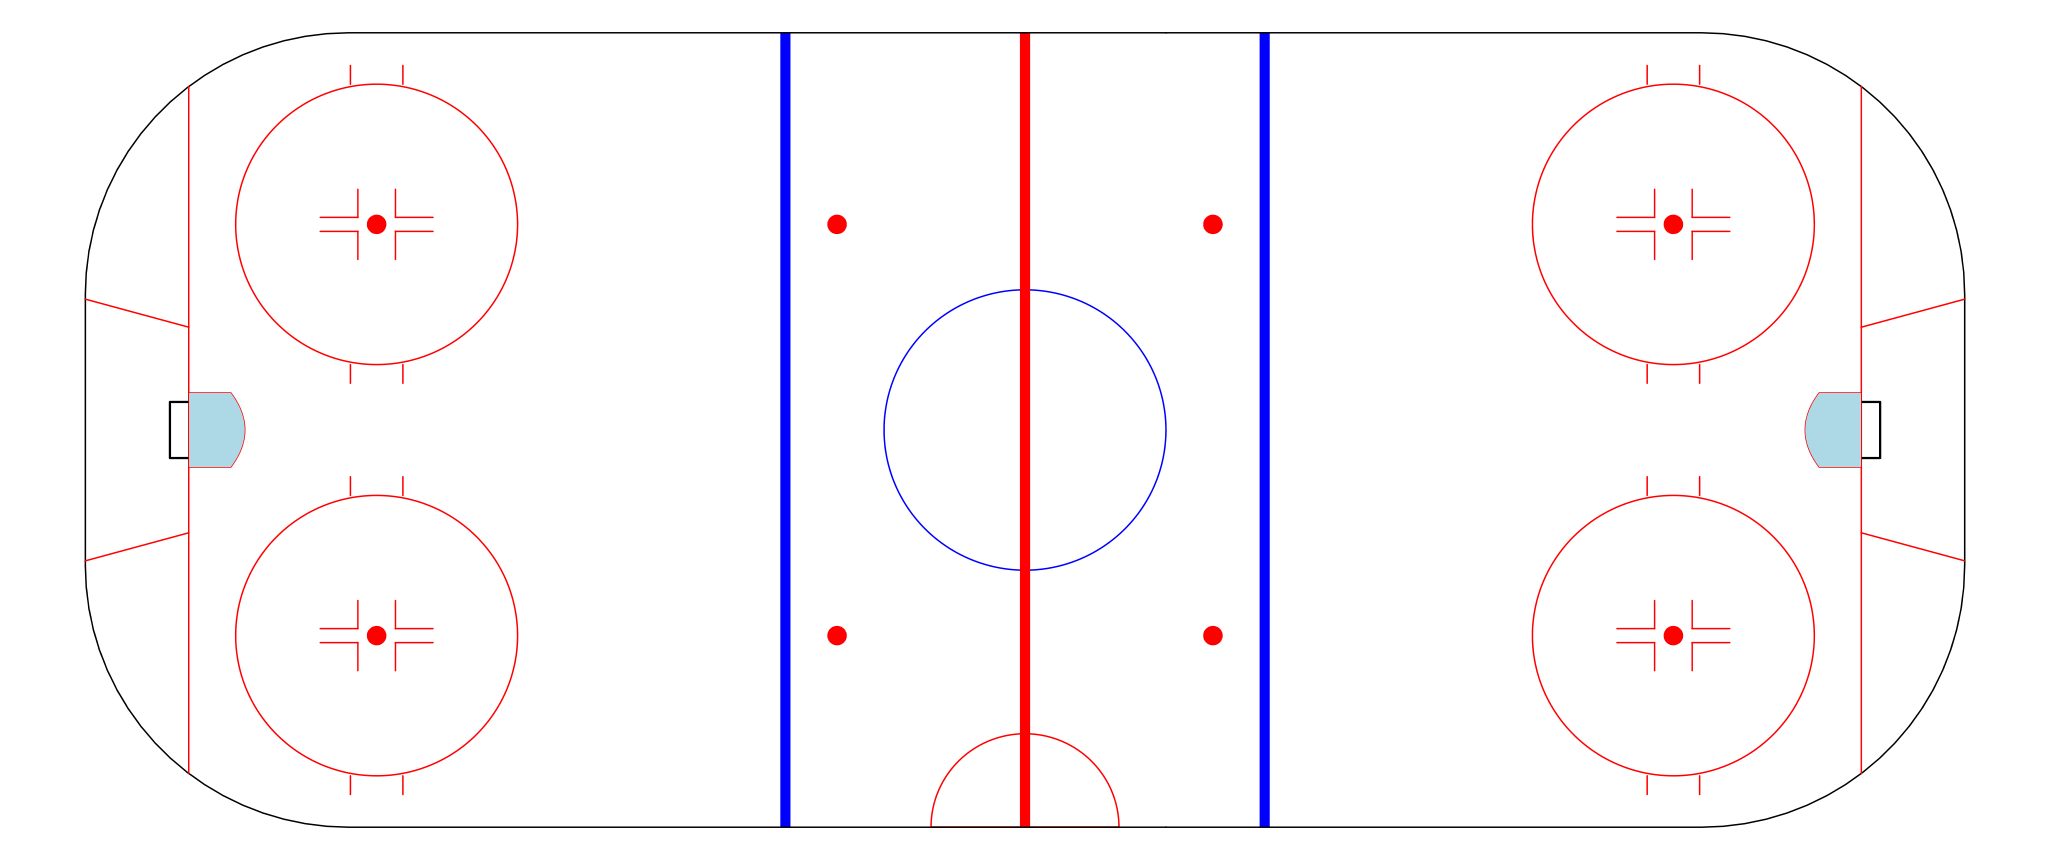
We had to construct our own image of an NHL rink for Hextally and other applications. Partly this is so we can superimpose our own images on top of it using NHL shot location data; partly this is because the images online — including on the NHL website! — are out of date, particularly in the corners.
So we rigged up the code necessary to reproduce it on command. Below is the thumbnail for the image; click on it to resolve the full image at 860×2050 pixels. See after the jump to reproduce it directly (though it will be vertically aligned). Update: New 5’7″ hash marks are now in the image and the code.
##############################################################################
#plotting elements for the rink proper.

faceoff.circle = function (x,y) {

  theta = seq(0,2*pi,length=300)
  #outer.
  polygon (x + 15*cos(theta),
           y + 15*sin(theta),
           lwd=2,
           border=2)
  polygon (x + 1*cos(theta),
           y + 1*sin(theta),
           col=2,
           border=2)
  segments (c(x-0.75,x-0.75, x+0.75,x+0.75, x-0.75,x-0.75, x+0.75,x+0.75),
            c(y-2,y-2, y-2,y-2, y+2,y+2,y+2,y+2),
            c(x-0.75,x-3.75, x+0.75,x+3.75, x-0.75,x-3.75, x+0.75,x+3.75),
            c(y-6,y-2, y-6,y-2, y+6,y+2,y+6,y+2),
            col=2, lwd=2)
 dd <- (5+7/12)/2
 segments (c(x-15, x-15, x+15, x+15),
           c(y-dd, y+dd, y-dd, y+dd),
           c(x-17, x-17, x+17, x+17),
           c(y-dd, y+dd, y-dd, y+dd),
           col=2, lwd=2)
}

goal.crease = function (flip=1) {
  xseq = seq(-4,4,length=100)
  polygon (c(-4, xseq, 4),
           flip*c(89, 83+xseq^2/4^2*1.5, 89),
           col="lightblue", border="red")
}

rink.plot.blank = function (...) {
  plot(c(42.6,-42.6), c(101,0), ty="n", ylim=c(101,25), xlim=c(-42.6, 42.6), ylab="", xlab="", axes=FALSE, ...)
}

rink.plot = function (fresh=TRUE, ...) {
  if (fresh) rink.plot.blank (...)
  rect(-42.5, 25, 42.5, 26, col=4, border=4)
  lines (c(-42.5,
           -42.5 + 28 - 28*cos(seq(0,pi/2,length=20)),
           42.5 - 28 + 28*cos(seq(pi/2,0,length=20)),
           42.5),
         c(15,
           72 + 28*sin(seq(0,pi/2,length=20)),
           72 + 28*sin(seq(pi/2,0,length=20)),
           15),
         col=1, lwd=2)

  goal.line.extreme = 42.5 - 28 + sqrt(28^2 - (28-11)^2)

  lines(goal.line.extreme*c(-1, 1), rep(89,2), col=2,lwd=2)        #the goal line.

  lines(c(-3,-3,3,3), c(90,92,92,90)-1, col=1, lwd=3)    #the goal net.
  goal.crease()
  segments(c(-11, 11), c(89,89), c(-14,14), c(100,100), col=2, lwd=2)

  faceoff.circle (-22, 69)
  faceoff.circle (22, 69)
}


full.rink = function () {

  theta = seq(0,2*pi,length=300)
  par(mar=c(0,0,0,0))
  plot(c(-42.6, 42.6), c(-101,101), ty="n", ylim=c(-101,101), xlim=c(-42.6, 42.6), ylab="", xlab="", axes=FALSE)

  polygon (15*cos(theta), 15*sin(theta), lwd=2, border=4)
  theta2 = seq (pi/2, 3*pi/2, length=300)
  polygon (42.5 + 10*cos(theta2), 10*sin(theta2), lwd=2, border=2)

  rect(-42.5, 25, 42.5, 26, col=4, border=4)
  rect(-42.5, -25, 42.5, -26, col=4, border=4)
  rect(-42.5, -0.5, 42.5, 0.5, col=2, border=2)


  lines (c(-42.5,
           -42.5 + 28 - 28*cos(seq(0,pi/2,length=20)),
           42.5 - 28 + 28*cos(seq(pi/2,0,length=20)),
           42.5),
         c(15,
           72 + 28*sin(seq(0,pi/2,length=20)),
           72 + 28*sin(seq(pi/2,0,length=20)),
           15),
         col=1, lwd=2)
  lines (c(-42.5,
           -42.5 + 28 - 28*cos(seq(0,pi/2,length=20)),
           42.5 - 28 + 28*cos(seq(pi/2,0,length=20)),
           42.5),
         c(15,
           -72 - 28*sin(seq(0,pi/2,length=20)),
           -72 - 28*sin(seq(pi/2,0,length=20)),
           15),
         col=1, lwd=2)


  goal.line.extreme = 42.5 - 28 + sqrt(28^2 - (28-11)^2)

  lines(goal.line.extreme*c(-1, 1), rep(89,2), col=2,lwd=2)        #the goal line.
  lines(goal.line.extreme*c(-1, 1), rep(-89,2), col=2,lwd=2)        #the goal line.

  lines(c(-3,-3,3,3), c(90,92,92,90)-1, col=1, lwd=3)    #the goal net.
  lines(c(-3,-3,3,3), -(c(90,92,92,90)-1), col=1, lwd=3)    #the goal net.
  goal.crease(); goal.crease(-1)
  ## traps.
  segments(c(-11, 11, -11, 11), c(89,89,-89,-89),
           c(-14,14,-14,14), c(100,100, -100,-100), col=2, lwd=2)

  faceoff.circle (-22, 69)
  faceoff.circle (22, 69)

  faceoff.circle (-22, -69)
  faceoff.circle (22, -69)

  faceoff.dot = function (x,y) {
      polygon (x + 1*cos(theta),
               y + 1*sin(theta),
               col=2,
               border=2)
  }
  faceoff.dot (22,20); faceoff.dot (22,-20); faceoff.dot (-22,20); faceoff.dot (-22,-20);

}

#full.rink()
#png("full-rink.png", width=860, height=2050); full.rink(); dev.off()
Pingback: Make your own NHL rink plot in R | WAR On Ice: ...