This is part of a series of “how to” posts about the site. In this series, we hope to describe and demonstrate how to use all of the features on war-on-ice.com. As always, if you have any comments, questions, or feedback, please reach out to us on Twitter.
Introduction: The Goaltender History page is very similar to the Goaltender Statistics page (which we described here). The key difference is that the goalie history page shows all traditional and modern statistics for an individual goalie over the course of their career. As such, it can be thought of as a “career statistics” page for goalies.
The page is accessible by clicking the “Goaltender History” link in the “Players” tab:
The goalie history page has two main sections: By Season and By Game. Each of these sections has its own tab and contains a sortable table and a customizable visualization tool.
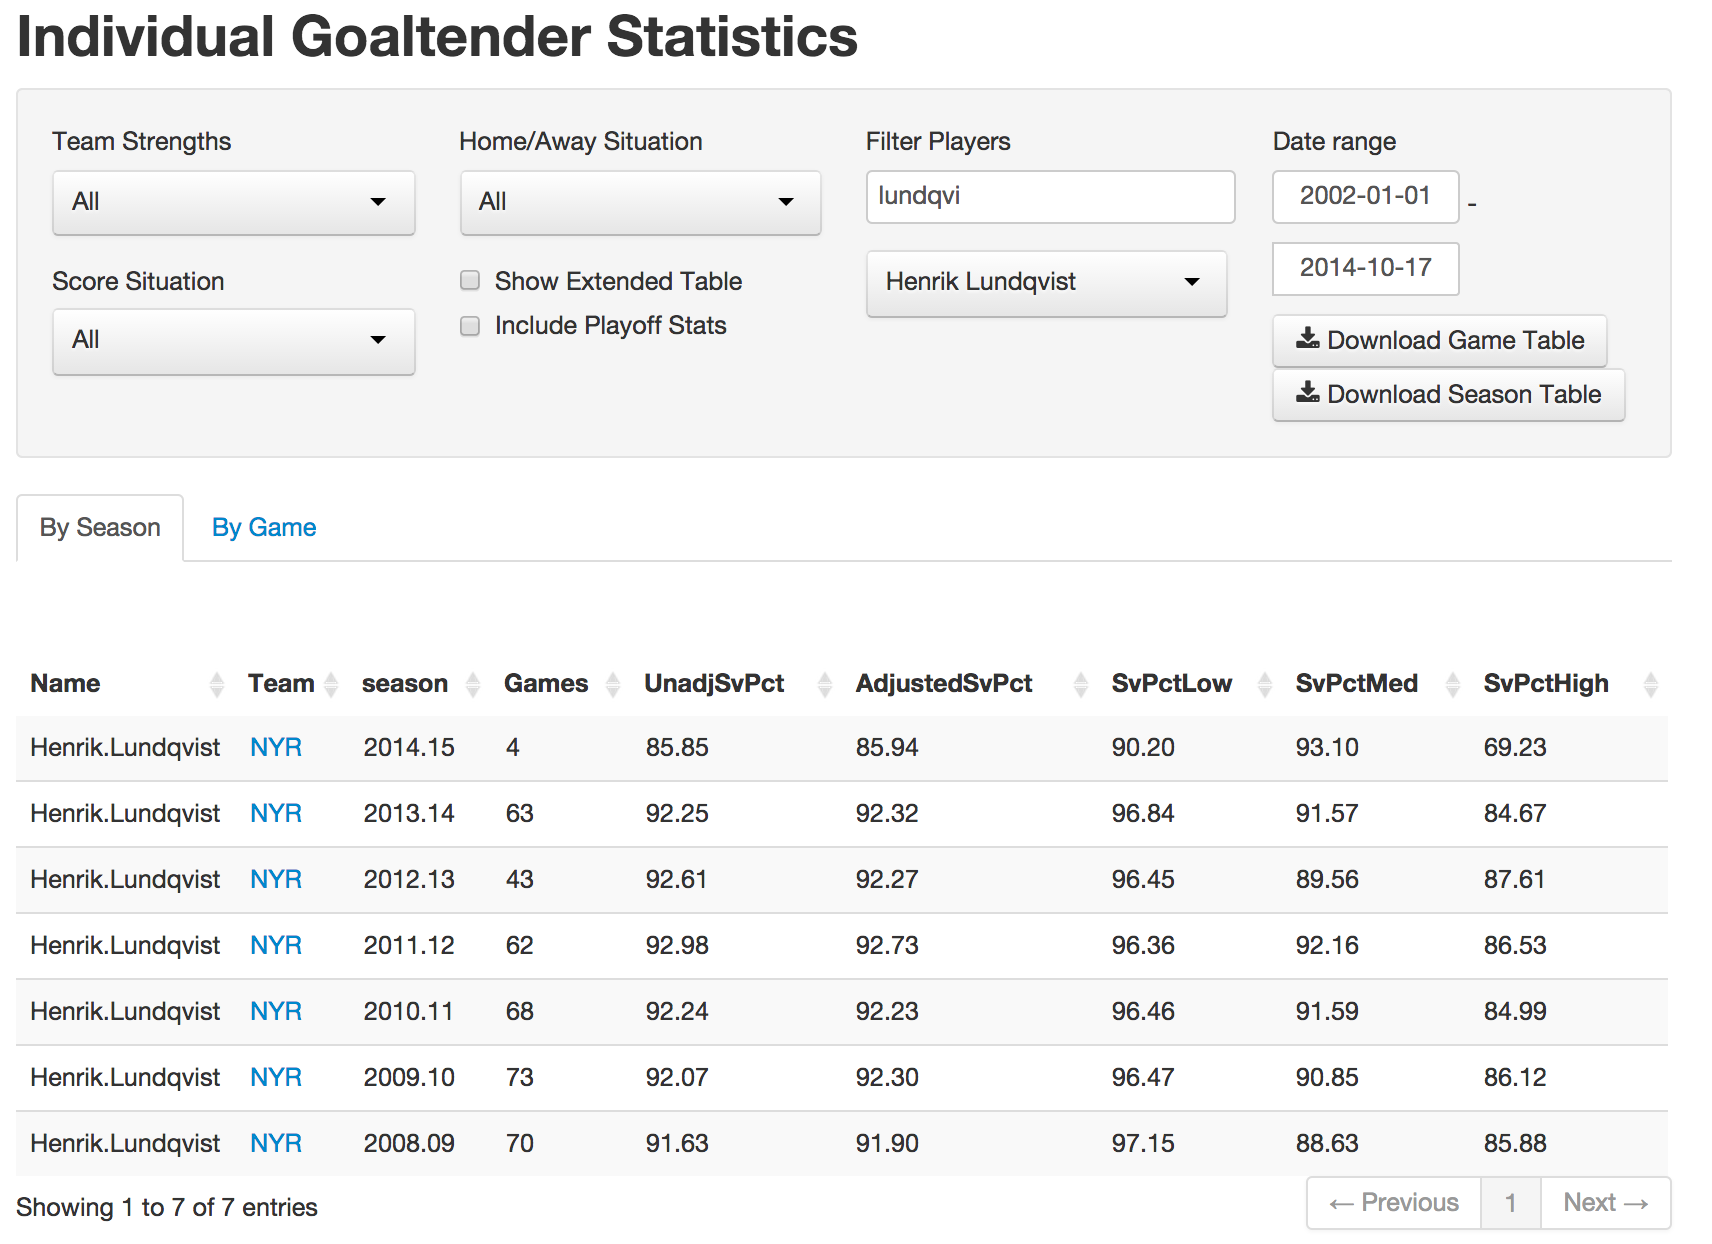
Career Statistics Table — By Season: The table functions exactly the same as the table in the goalie statistics page (described above) with a few caveats:
- By default, the “By Season” tab is selected.
- Table entries are now individual seasons for the same goalie, rather than multiple goalies over the same timespan.
- You can include playoff statistics as separate entries in the table by clicking the “Include Playoff Stats” checkbox.
- As always, you can filter by date, home/away situation, man-strength, and score situation.
- As always, you can download the table to a .csv file by clicking the “Download Season Table” button (top-right).
- As always, you can share the page by clicking the “Share This Page” button at the bottom-left.
The table shows Jonathan Quick’s career statistics by default. To see another player’s career statistics, simply type the player’s name into the “Filter Players” textbox:
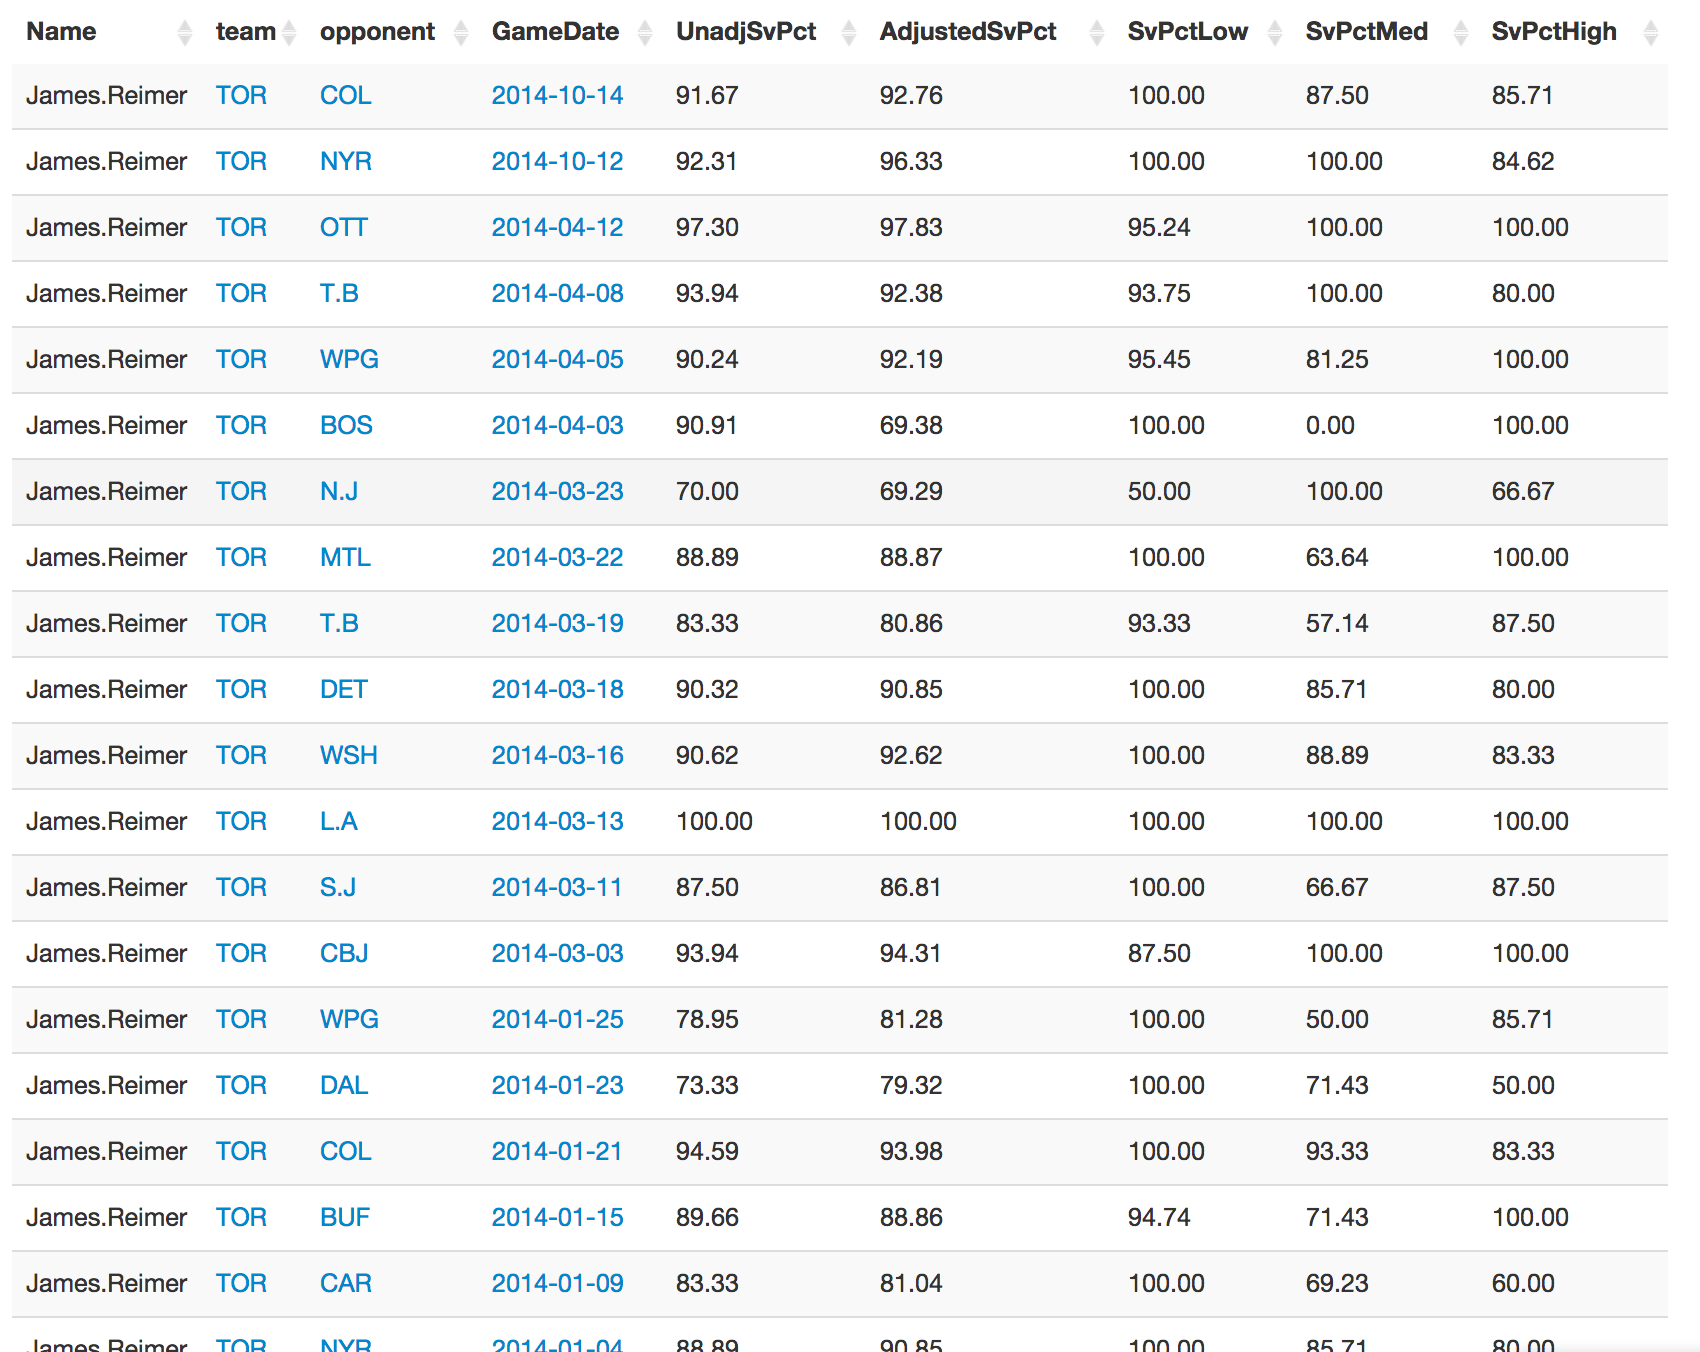
Career Statistics Table — By Game: In this version of the table, statistics from every game in a goalie’s career since the 2008-09 season are quickly viewable.
- To view the game-by-game table, select the “By Game” tab.
- Table entries are now individual games for the same player.
- You can include statistics from playoff games as separate entries in the table by clicking the “Include Playoff Stats” checkbox.
- As always, you can filter by date, home/away situation, man-strength, and score situation.
- As always, you can download the table to a .csv file by clicking the “Download Season Table” button (top-right).
- As always, you can share the page by clicking the “Share This Page” button at the bottom-left.
An example career statistics table (by game) is shown here for James Reimer:
Sorting the Tables: You can sort either table by any column clicking the header of that column. A few notes:
- By default, the first click will sort in ascending order. If you click the column header twice, it will sort in descending order.
- To sort by multiple columns simultaneously, hold Shift and click the headers of the columns by which you wish to sort.
Career Statistics Plot — By Season: This plot functions exactly like the plot on the goalie statistics page, described above.
One of the more useful and interesting features is to set the x-axis to be “Time”, which allows you to view the goalie’s statistics across all seasons in his career (including playoff statistics, if desired):
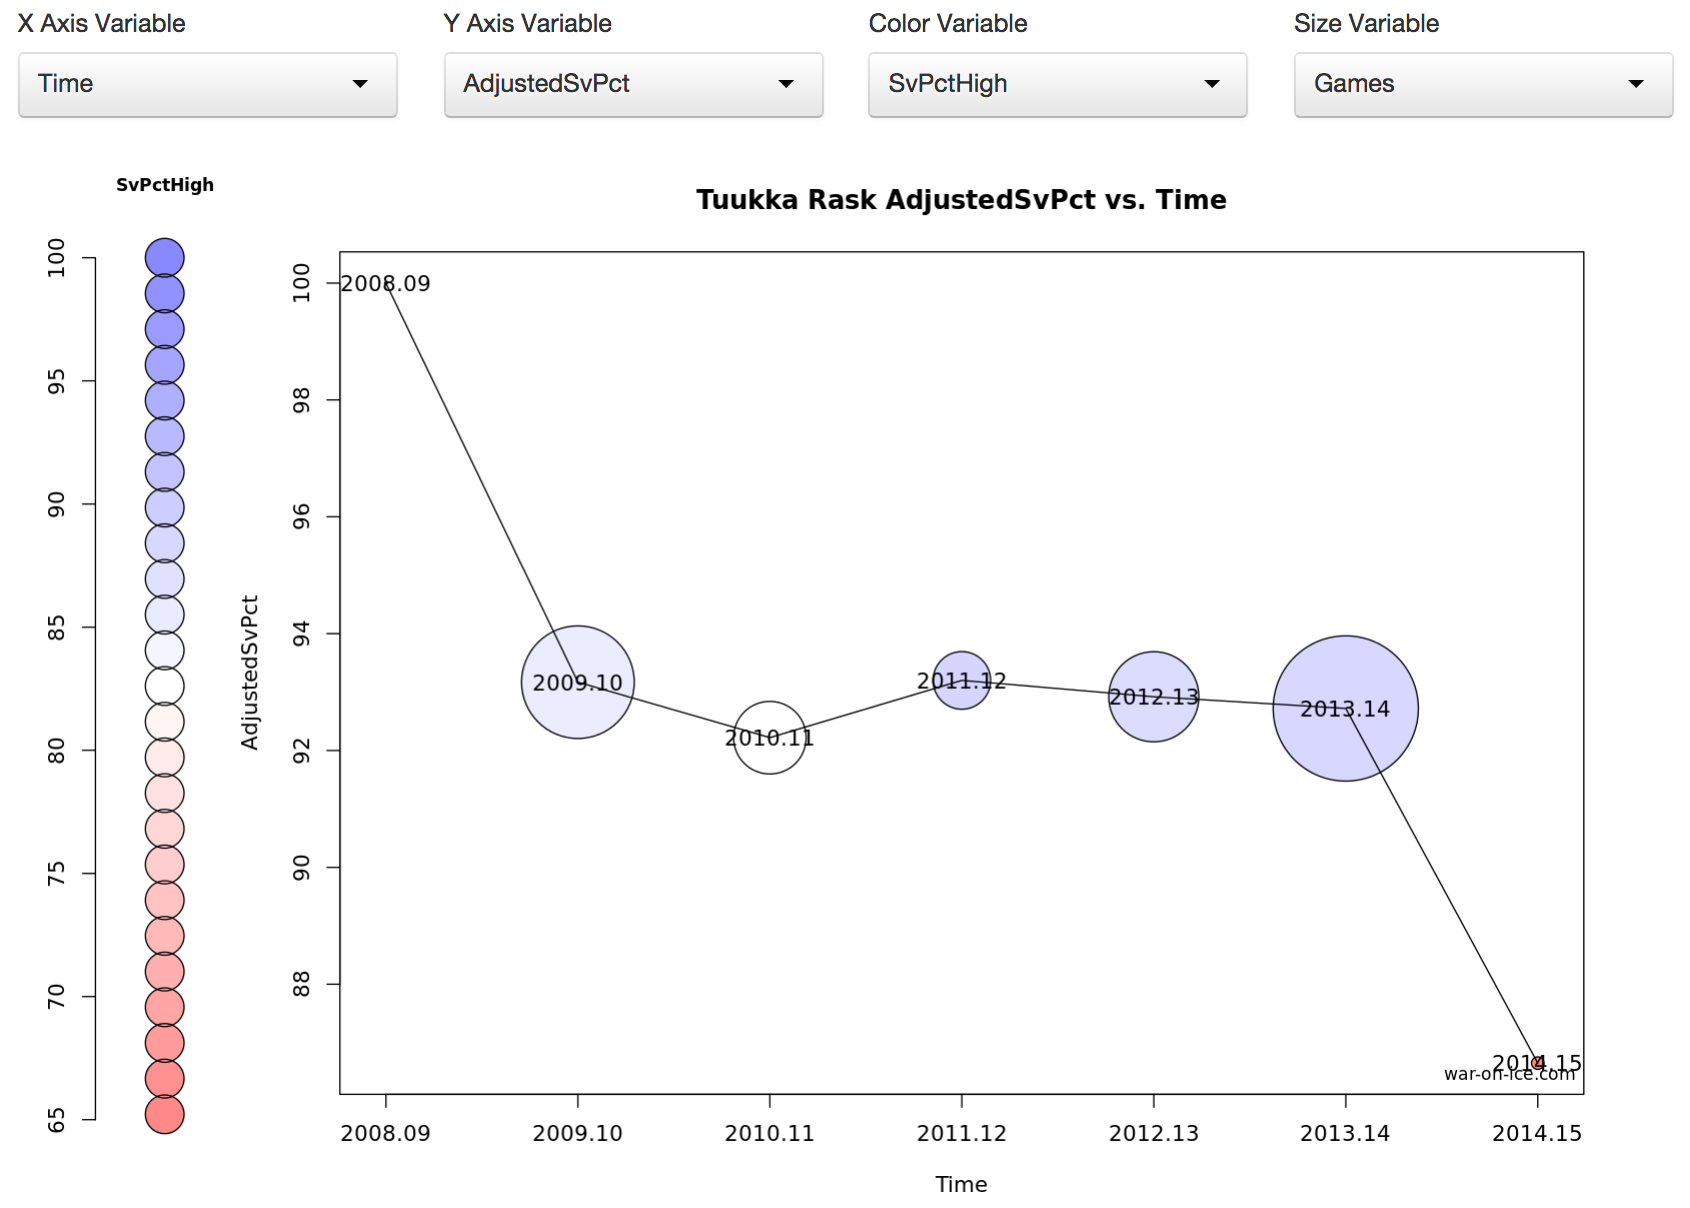
The above plot shows Tuukka Rask’s Adjusted Save% over time, colored by his Save% on high-percentage shots and sized by the number of games played.
Career Statistics Plot — By Game: The final feature on the goalie history page allows you to compare the game-by-game statistics of individual goalies across their careers. Under the “By Game” tab and at the bottom of the page, see the following plot:
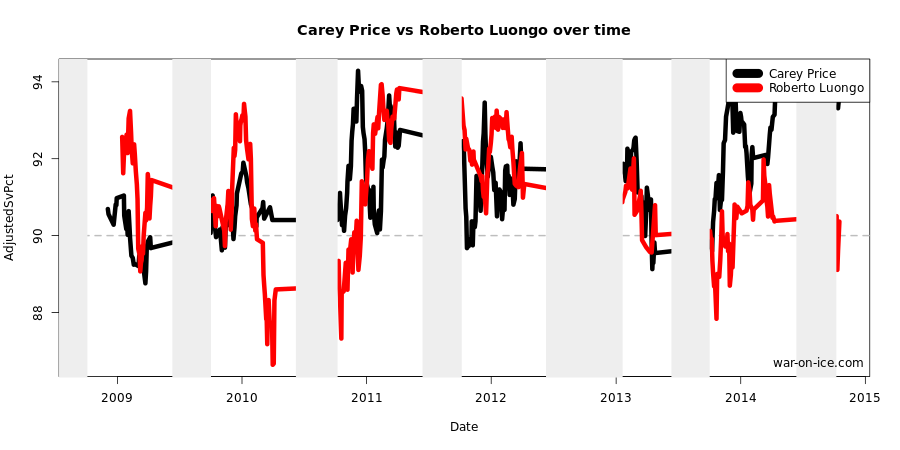
The above plot compares Carey Price’s and Roberto Luongo’s game-by-game moving-average Adjusted Save% over the course of their careers. A few notes:
- To compare your goalie with another goalie, type the second goalie’s name into the textbox above the plot (e.g. “luongo” above).
- To change the y-axis variable, simply choose a new variable from the “Y-Axis Variable” drop-down menu (e.g. “AdjustedSvPct” above).
- Game-by-game statistics are shown as a “moving average”, with a default of 20 games in the moving average. To change the size of the moving average window, simply adjust the slider (e.g. “33” above). Right = more games in moving average, Left = fewer games in moving average.
- To show only a single goalie’s game-by-game stats in the plot, you can either leave the second textbox blank, or type the same goalie’s name in the second textbox (e.g. change “luongo” to “price” or blank above).