This is the first in a series of “how to” posts about the site. In this series, we hope to describe and demonstrate how to use all of the features on war-on-ice.com. As always, if you have any comments, questions, or feedback, please reach out to us on Twitter.
Warning: Since this is the first “how to” post, it is a bit long. Future posts will be much shorter.
Introduction: The skater statistics page was the first page we developed for WAR On Ice, and it contains the bulk of the statistical content for forwards and defensemen on the site. The page is divided into two main sections:
- Table: A searchable, sortable, downloadable table of traditional and modern metrics for all NHL forwards and defensemen since 2002
- Plot: A customizable graphing tool for visualizing traditional and modern metrics for all NHL forwards and defensemen since 2002
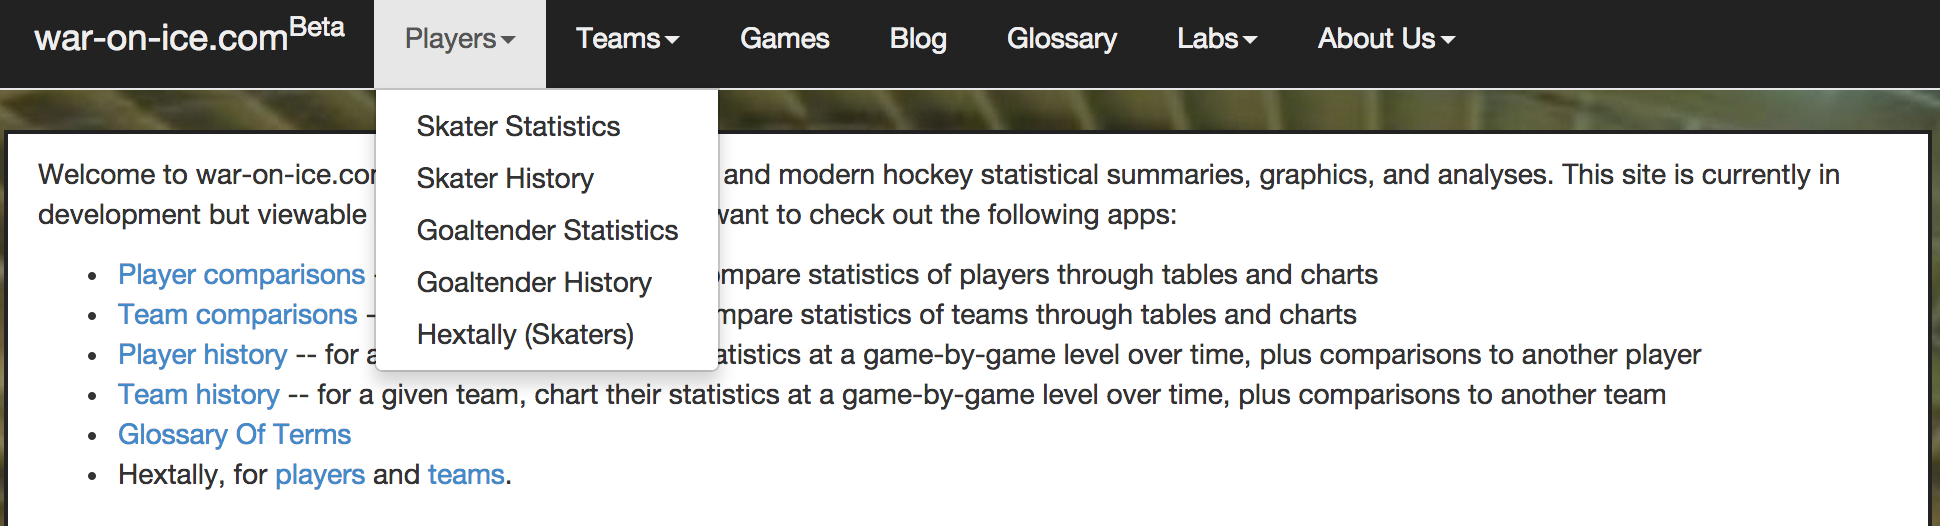
The page is always accessible from the “Skater Statistics” link in the “Players” tab:
Player Statistics Table: At the top of the skater statistics page is a group of drop-down filtering menus, followed by a table:
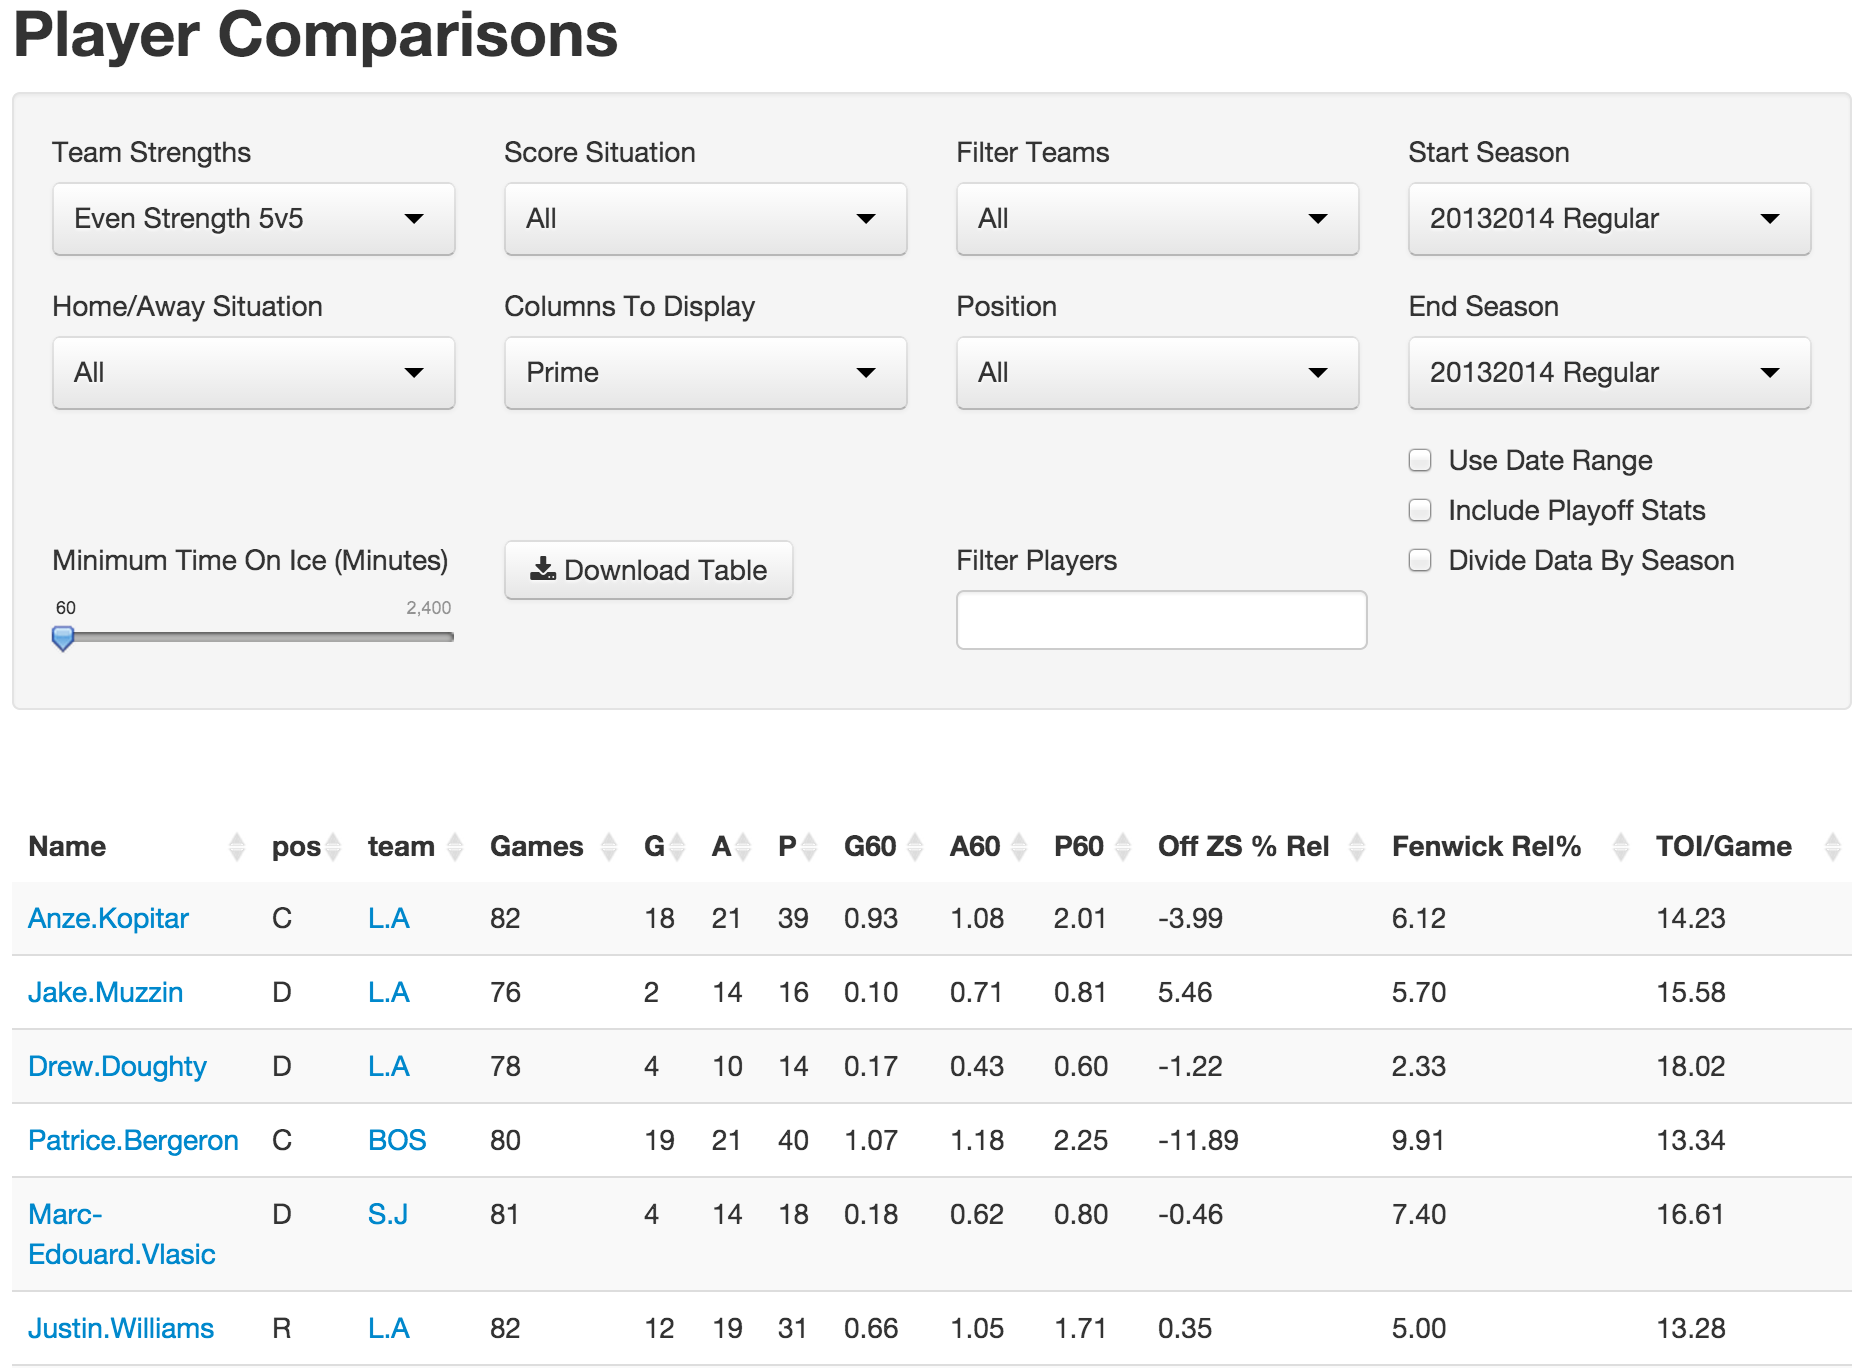
In the drop-down menus, you can choose to filter the table by:
- Team Strengths: even-strength (5-on-5), power-play, shorthanded, 4-on-4, other
- Home/Away/All
- Score Situation: all, close, tied, leading by 1, trailing by 1, etc
- Teams: Choose your team of interest from the drop-down menu to view/plot stats for players from that team
- Position: All, C, LW, RW, All Forwards, Defense
Seasons vs. Date Range: On the right-hand side, you can choose either (1) the seasons or (2) the date range you want to include in the skater statistics table. The table will automatically aggregate all statistics from those dates.
- Seasons: “Start Season” is the first full season you want to include in the query. “End Season” is the last full season you want to include in the query. So, for example, if you want to view stats from the last 5 years, you can set “Start Season” to be “20092010 Regular” and “End Season” to be “20132014 Regular”.
- Date Range: Filter by date by clicking the “Use Date Range” checkbox. When you do, “Start Season” and “End Season” will be replaced with an interactive date range selection feature.
- Playoff Statistics: In both cases, if you want to include statistics from playoff games, click “Include Playoff Stats”.
Filter Players: To compare specific sets of players, use our customizable player comparison tool. Simply enter the players’ names in a comma-separated list in the “Filter Players” box:
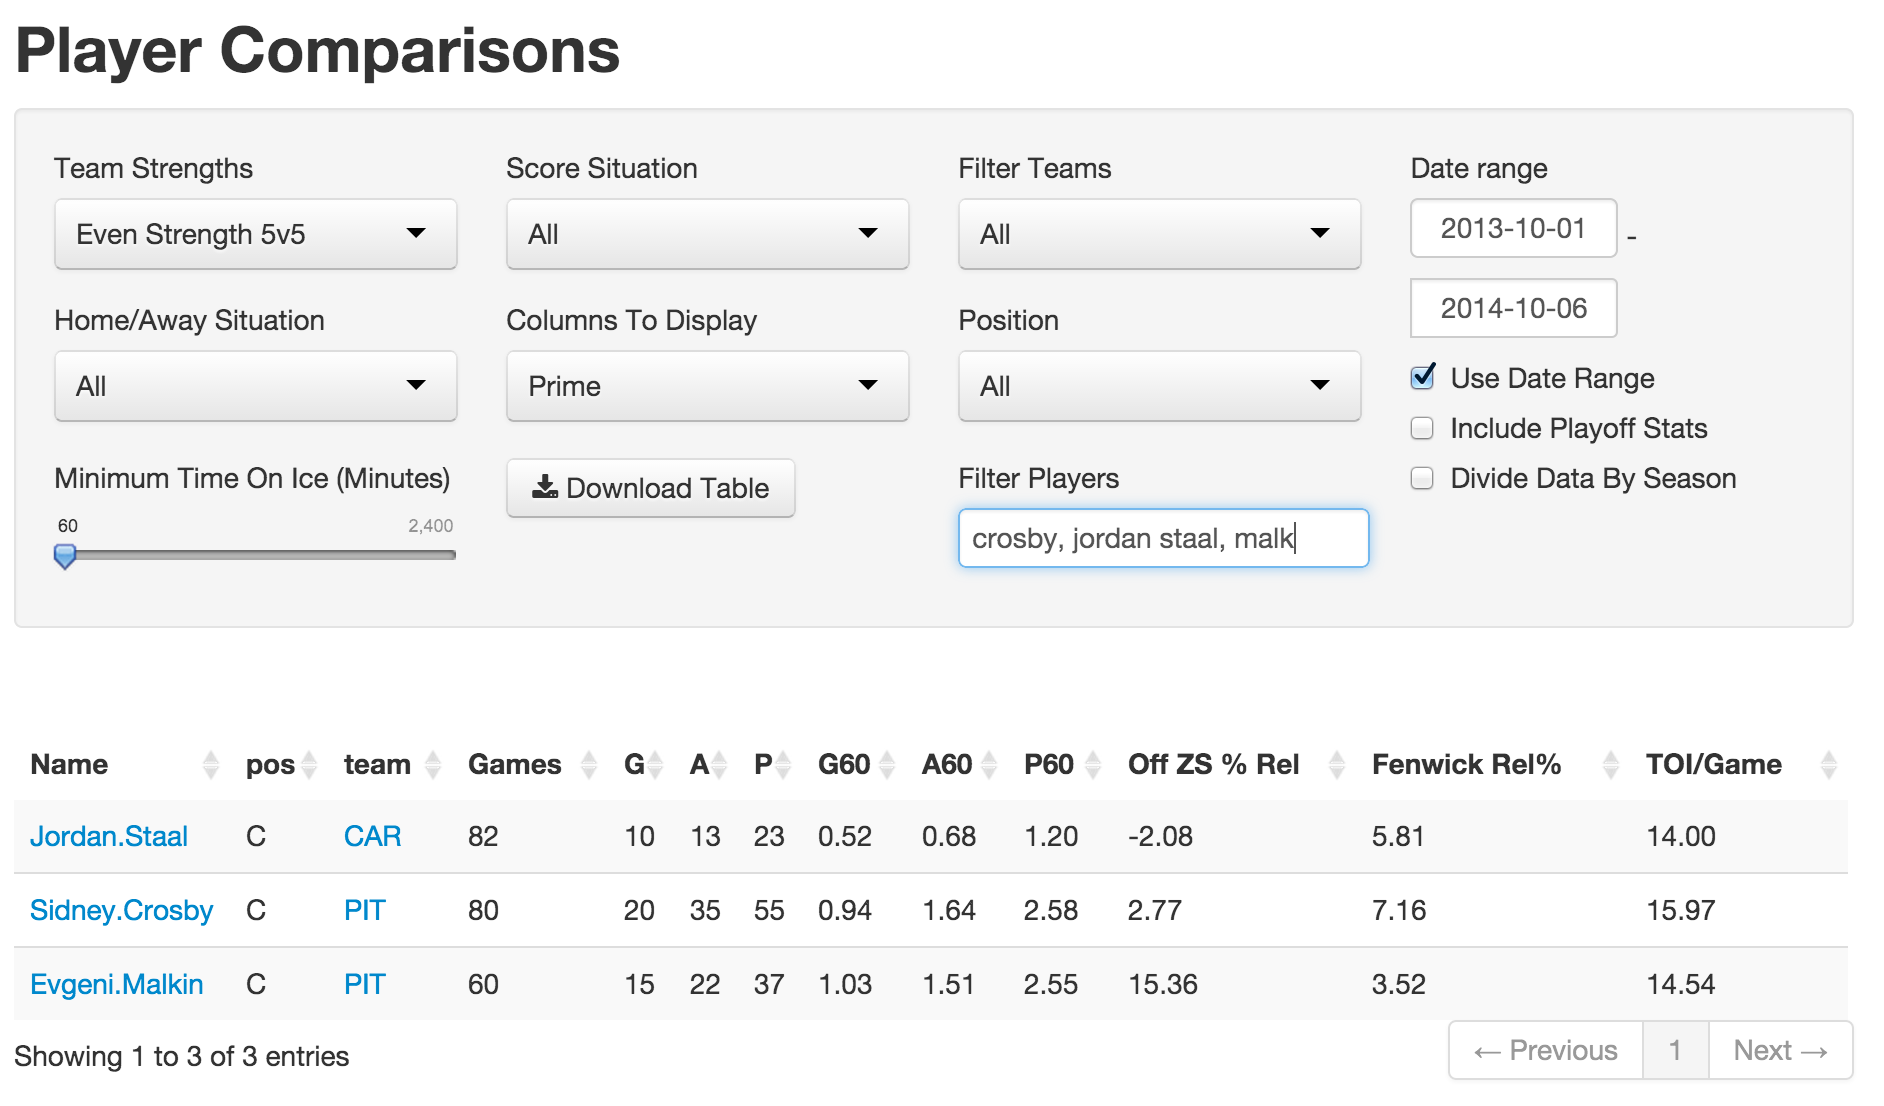
The name search feature is very flexible. For example, “crosby” will add Sidney Crosby to the table, as expected. But “malk” will add Evgeni Malkin to the table, since he’s the only player since 2002 to have that “malk” as part of his name. For players who share a last name with other players, enter their first and last name, e.g. “jordan staal” for Jordan Staal.
Columns to Display: The skater statistics page contains a substantial amount of information. To help users sort through this information, we put the table columns into groups, which you can select from the “Columns to Display” drop-down menu. The default set of columns to display is “Prime”, which includes:
- Basic info: player name, position, team, number of games
- Goals, assists, and points (regular and per 60)
- Offensive zone start % (relative to team)
- Fenwick% (relative to team)
- TOI per game
Other options:
- Fenwick: Displays basic info plus Fenwick stats for all players in the table
- Corsi: Displays basic info plus Corsi stats for all players in the table
- Shot-based: Displays basic info plus shot-based stats for all players in the table
- Goal-based: Displays basic info plus goal-based stats for all players in the table
- Faceoffs: Displays basic info plus faceoff stats and zone start percentages for all players in the table
- Base Counts: Displays basic info plus other RTSS stats (e.g. hits, missed shots, blocked shots, penalties draw, penalties taken, etc) for all players in the table
- Teammate/Competition: Displays basic info plus quality of teammate / competition statistics (e.g. QoT_Corsi and QoC_TOI) for all players in the table
- All: Displays all of the above
Regardless of which option you choose, you can sort the table in ascending or descending order by simply clicking the column header.
Sorting: You can sort the table by any column clicking the header of that column. A few notes:
- By default, the first click will sort in ascending order. If you click the column header twice, it will sort in descending order.
- To sort by multiple columns simultaneously, hold Shift and click the headers of the columns by which you wish to sort.
Custom Visualization Tool and Player Usage Charts: One of our primary initiatives in creating WAR On Ice was to make it easy for users to create customizable player statistics charts with any information available on the site. Luckily, we built the site using R and Shiny, statistical programming tools with built-in visualization functions.
With our custom visualization tool, users are free to choose any information they want (e.g. Corsi%, TeamGoal%, Offensive Zone Start %, TOI/Game, etc) for the x-axis, y-axis, point size, and color variable. Simply choose each variable from the drop-down menus, and the plot will automatically update.
The default plot settings correspond to Rob Vollman and Robb Tufts’ Player Usage Charts. For example, here is the player usage chart for the Los Angeles Kings at even-strength in 2013-14:
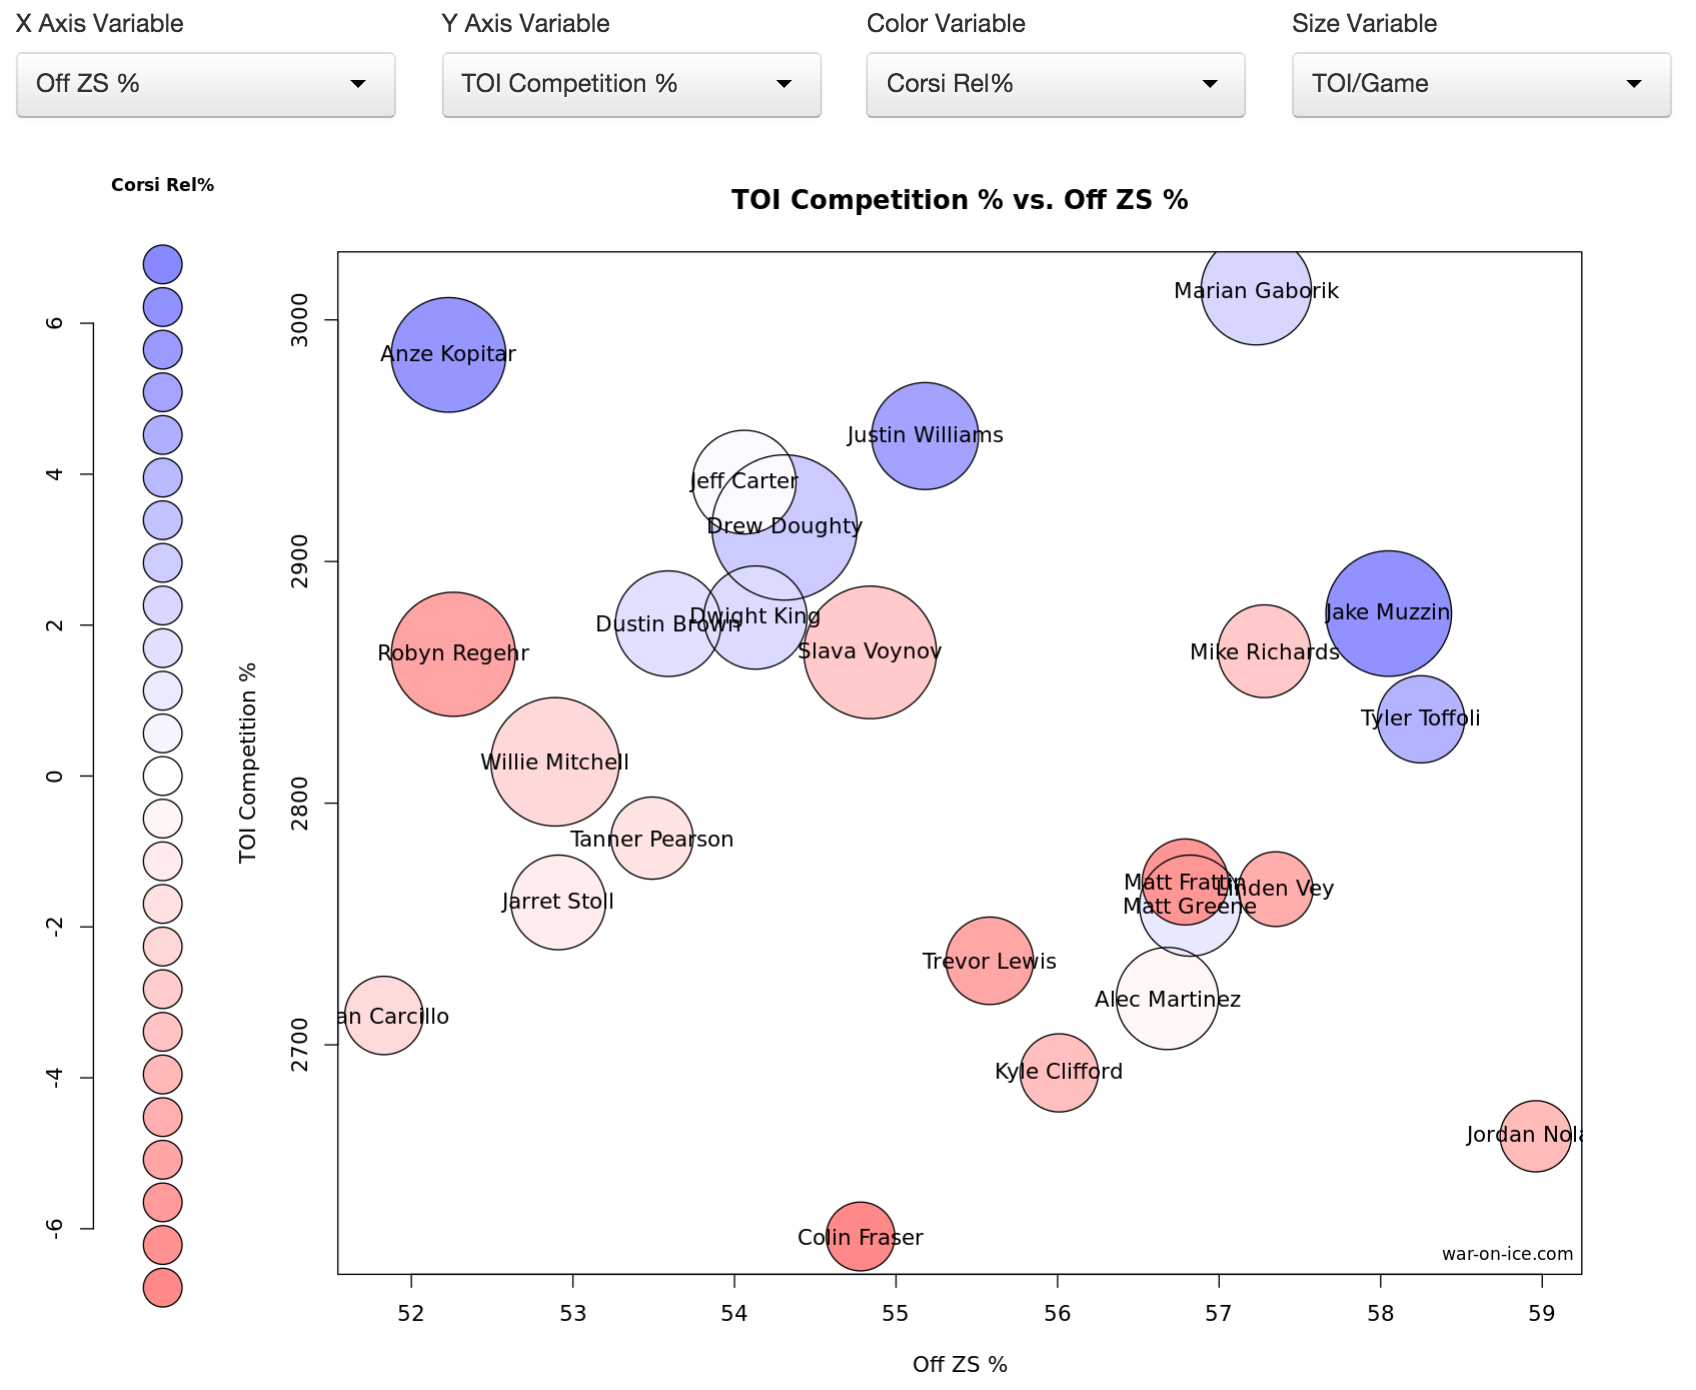
Note: The choices made at the top of the page (e.g. man-strength, home/away, score situation, etc) carry over from the table to the plot. That is, the plot simply displays a custom subset of the data from the table.
Pingback: How To Use Our “Skater History” Page | WAR On Ice: The Blog