Category Archives: Uncategorized

The Road to WAR, Part 10: Modern Goaltending and Shooting

Preamble: here’s where we start to integrate the pieces of WAR together a bit more. If you want to sneak ahead and look at the results, you can look here for the app being updated regularly.

This is where things get a little more interesting for us. We have a lot more information on the last 12 NHL seasons when it comes to the circumstances of every shot on goal, particularly after Lockout II from 2004-2005. We know the players on the ice, the approximate location of the shot and the shot type, loads of detail that can help us identlfy skill not only for both goaltenders and shooters, but also for the other players on the ice.

This volume of data can, of course, also lead us into trouble if we’re not careful. So bearing in mind that we’re trying to estimate both the talent and performance of players for scoring and preventing goals, we’re going to break this into a few smaller pieces:

  1. The process of generating shot attempts, at each level of danger, given the skaters for both teams (and not their goaltenders), is temporal and measured in rates. This will be done for skaters in the next post but uses the same approach as in Goals Above Baseline for teams.
  2. The success of each shot taken, given first the skaters and goaltenders, and if possible, the playmakers and defenders.

The most important point we’re making here is that we’re conditioning on the fact that a shot was taken. We’re not measuring here the likelihood that a replacement player on an other average team would be in a position to get that shot — that happens in the shot generation piece of our approach.

We’re going to build this in stages to make sure everything is as we expect, and figure out where any surprises might happen before answering the bigger questions.

Continue reading

A brief pause, in which we discuss the different kinds of questions we should be asking, and the difference between talent and performance

One of the biggest questions when it comes to WAR is exactly what question we’re trying to answer by constructing these measures. There are a few that we need to address, because they’re often all asked at once.

  1. What actually happened?
  2. What would have happened, given what we know now, and events repeated over again?
  3. What would have happened (if we had made a change)?
  4. What’s going to happen next?
  5. What will happen next, if we can make a change?

For each of these points, the answer seems clear. The biggest issue is that they often overlap, and figuring out exactly what questions we’re answering is a bit more difficult. When it comes to what we’re trying to learn about players,

What actually happened? 

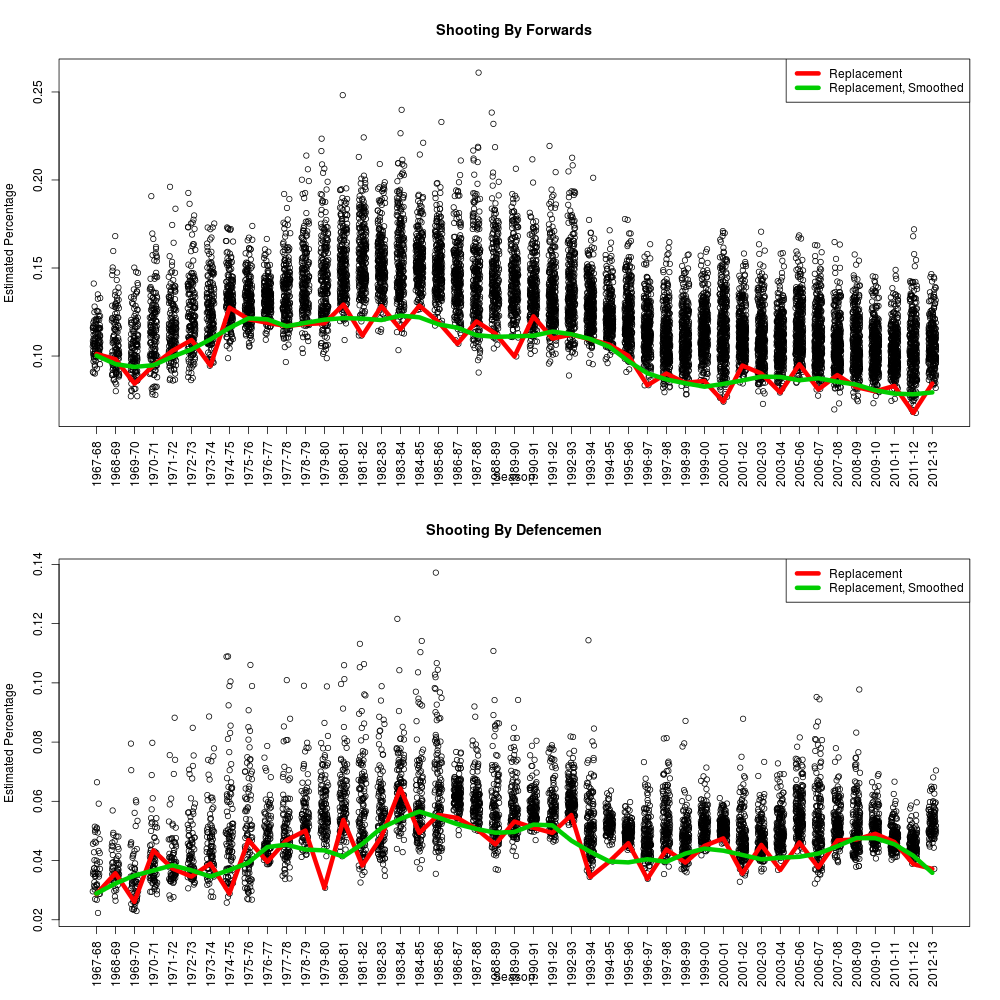
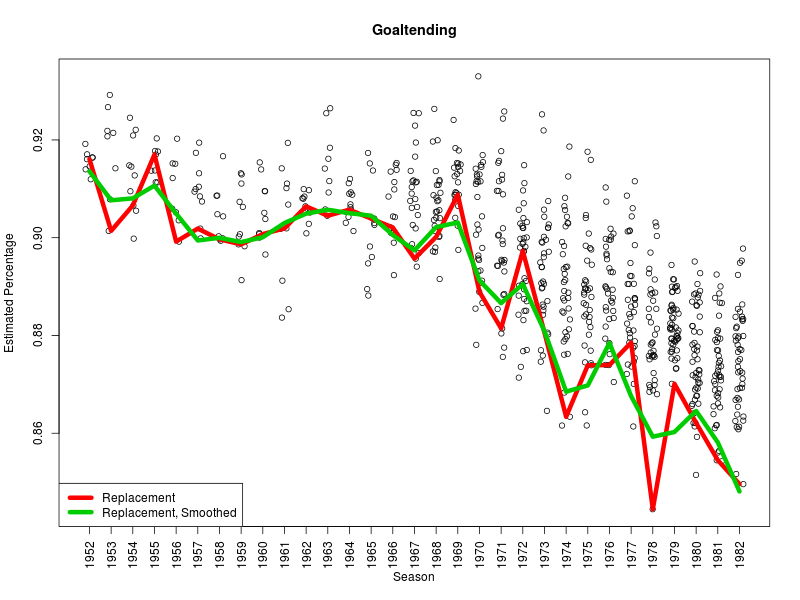
This is the most clear-cut to express. The numbers themselves are not adjusted for anything; players with abnomally high shooting percentages get to keep the goals they scored, and defensemen who allow a large number of shots are still victimized by their iess competent linemates in the final totals. And ultimately, this is how we measure performance.

The problem is, these measures are meaningless without context. In the strictest sense, it’s impossible to compare two player performances because we can’t known exactly how player A would have performed in the events in which player B was involved.

This is why…

What would have happened (if we had made a change)?

is the midpoint that lets us answer those questions, since the change in question is “what if we swapped out our player in question and replayed the game over?”

This is the simplest adjustment: a baseline for context. What would be expected to happen to a stand-in player in similar circumstances? “Average” levels are a reasonable start, but we endorse the idea of “replacement” because that’s our best guess of who would have to take that job next if something came up.

So for the purposes of WAR, we’re not making adjustments to the actual observed events, only to what we expect would have happened. And its primary purpose is not to forecast future performance. This is the current approach we’re using for our WAR measures, partly because it’s the least difficult to understand, but we’re not limited to it.

Best widespread sports example: MVP voting (eventually).

This connects to…

What would have happened, given what we know now, and events repeated over again?

This is what we’re getting at when we try to measure talent; if the situation repeated itself, with the same conditions, what kind of an outcome would we be most likely to see.

This can involve quite a bit of adjustment, mostly to get rid of noise in small samples but also to gain strength from the system as a whole. Results that are inconsistent with others are treated with suspicion and examined carefully.

Best widespread sports example: Barstool arguments over who was better, Gretzky or Lemieux, if they happened between Sam and Andrew.

What’s going to happen next?

This is pure prediction — gambling if you’re losing, arbitrage if you’re winning. We don’t get to fiddle any knobs, change any rosters or have any kind of pretend control over the future. Our only task is to guess what’s to come and with what certainty.

The distinct thing about this is that the proof of the pudding is in the eating: it doesn’t really matter to people how you cooked up your estimates, because credibility is earned by being right more often in the long run.

Best widespread and legal sports example: Fantasy leagues.

What will happen next, if we can make a change?

Ideally this is a question that connects back through the previous threads: screening out noise, estimating talent levels, forecasting forward and projecting to future outcomes — given that we have decisions to make and courses to change.

By and large this is separate from the immediate question of estimating WAR for past seasons, particularly if it’s a question of performance measurement and not talent. But it is connected in that it would be worth knowing what skills are worth what amount in salary and development.

Best example: The actual business of sports.

The Road to WAR, Part 9: Historical Shooting and Goaltending

Thanks to Benjamin Wendorf of (among other places) hockey-graphs, we have a collection of historical shot data for skaters from 1967-2013, and for goaltenders from 1952-1982. We can use this to explore the basics of replacement shooting and goaltending under the barest of definitions — the success rate for forwards, defensemen and goaltenders based on shooting and save percentage. What we take from here, we’ll use in the next round with our full database using our refined shot data.

First, we use the Poor Man’s Replacement to mark all shooters with less than 30 shots in a season, and goaltenders facing fewer than 300 shots, as the players whose joint results are our gauge for replacement-value talent. We then run these through a binomial model where results are shrunken toward a common mean in each year; the more shots each player has, the closer the result is to the observed shooting percentage. The original estimates of replacement value are a little noisy from year-to-year, so we use a loess smoother to establish an “expected” replacement value over time.

Our estimates over time for replacement shooting are below:

replacement-shooting

There is a clear elevation in overall and replacement shooting percentage for forwards through the 1980s; there is a more modest but similar bump for defensemen.

The same pattern is detectable in replacement-level goaltending; the difference is in the effective range of save percentages, which is far smaller than the range for shooters.

replacement-goaltending

Now that we have replacement-level shooting and goaltending, the correction for each player is straightforward — how many goals would a replacement player score/allow on the same number of shots.

We have a reduced table of outcomes posted here for seasonal and total results. Highlights include Lemieux-Gretzky-Gretzky finishing 1-2-3 for goals above replacement in shooting success, though the most impressive result to me is Steven Stamkos finishing at number 8, one of the few high-achieving performances in the Bettman era. Since the goals to wins ratio was higher in that time, converting to pure WAR would yield an even more impressive result.

So why not stick with this method right away? This might be adequate in the long run — and we’ll be checking it with our data as we go — but there are a few opportunities to upgrade on it.

  • We know what goaltenders saved what shots; checking the quality of competition is natural.
  • We have moderately reliable location data and drop-ins for rebounds and rush shots. All of these factors are known to increase the likelihood of a goal.
  • We have game situations and score; even accounting for the danger of the shot, there’s still a change in goal likelihood that we should build in.
  • Finally, we ought to test whether or not we can detect playmaker effects or the defensive efforts of the opposing skaters. If these effects are substantial, they should be detectable over long periods of time or in particular subsets of the data.

Links: Top and bottom outcomes by season and overall for skaters and goaltenders.

GUEST POST: A Call To Action on Crowdsourced Data — How You Can Help Usher In a New Era of Hockey Stats

Editor’s Note: This post was written by Emmanuel Perry (@MannyElk) and Ryan Stimson (@RK_Stimp) to describe their crowdsourced projects. We are happy to partner with them to help join their data back to our database, not just to spare them to extra work of linking back to the standard set, but to make it easy on them so that it can all be shared publicly.

EP: While listening to a particularly riveting episode of TSN Hockey Analytics featuring one co-webmaster of the site you’re currently reading this on, I heard something that piqued my interest. Andrew Thomas stated his openness to hosting fan-sourced data on the site and went on to mention he had begun working with Ryan Stimson to try and make this happen. I was already aware of Stimson’s Passing Project and was excited at the prospect of having such unique and valuable information shared publicly on an established online platform. I myself had been involved with collecting and sharing manually-tracked data of a different type, but had not considered expanding this project until now.

I believe fan-sourced data will provide the tools we need to advance this field into a new era. Certainly, in the absence of chip-tracking technology, this new data can catalyze new ideas and take our analysis of the sport new places. Good things don’t always come easy and indeed, entire seasons worth of data require thousands of often tedious hours. Projects like Stimson’s and mine require a collective effort and I’m asking for your help. Before I go on, here’s a little bit on our respective projects:

RS: The Passing Project

As the hockey analytics community gathers more information on how goals are scored, there’s been an emphasis on pre-shot movement and passing. Steve Valiquette introduced the concept of the Royal Road. The link Manny provided in the opening paragraph discusses the fact that teams shoot at a higher percentage as the number of passes preceding the shot attempt increase. The focus of this project is on capturing what happens prior to the shot attempt in several forms: sequence (one pass, two passes?), location (offensive zone passes, transition passes, Royal Road passes?), and efficiency (which players generate shots more often than others?). As we’ve gathered data on 340 games from this season alone, I’m more confident than ever in saying that what happens before the shot is attempted matters significantly more than where the shot is taken.

If you’re curious how we do this, you can visit this page where myself and five of my trackers take you through a period and explain what we do. For more detail, you can read some of my earlier findings from the hockey analytics conference at Carnegie Mellon University here and watch my presentation here (I start around the 20:00 mark.)

EP: Between The Lines

Our goal is to collaboratively record all blue line events during the 2015-2016 NHL season. In addition to zone entries, all instances of the puck entering or exiting a zone will be recorded. Thus, the location of the puck is known at any given second, allowing us to extrapolate stats dealing with zone time or transitions. In particular, these stats bring us closer to identifying specific aspects of the game on which players can have a direct positive or negative impact. I outlined potential applications of this data in my presentation at the hockey analytics conference at Carleton University in Ottawa, which you can listen to here.

Since Ryan’s project was initially proposed, he’s received significant interest and has accrued a handful of volunteers. In the few weeks since I proposed mine, I’ve gotten similar interest for which I am very grateful. In order for these missions to come to completion, however, I regret to say we’ll need more help. If you’re interested in contributing towards what we both firmly believe is a hugely important movement in the field of hockey analytics, please contact* either of us and we’ll be happy to provide additional details.

EP&RS: In addition to recruiting volunteers, Ryan and I have opened a crowd-funding campaign that you can view here. The money we raise will be put towards GameCenter Live subscriptions for our trackers and compensating Andrew and Sam for the time and effort they will dedicate to processing and hosting this data. [Ed: We'll use it to pay for the server costs. -AT] Know that your donations will go a long way in helping this latent information travel from the ice surface to your computer screen.

Contact information: Emmanuel Perry (@MannyElk) and Ryan Stimson (@RK_Stimp)

UPDATES: Calculation Changes for Teammate/Competition Statistics

Teammate and competition statistics have value for two main reasons:

  • Adjusting observed outcomes to account for boosts or drags in performance by factors beyond the player’s control, and
  • Assessing the coaching staff’s deployment (“usage”) of a player.

The main two of these are based on all shot attempts (Corsi) and the amount of time these players spend on the ice (since, oddly enough, better players are used more.) Both of these are useful for their purpose, but both are better served by having a summary quantity of these that are predictive of future behaviour, since they reflect both a locally accurate version of player ability and the state of the coaching staff’s current information.

To benefit both these factors (and to make our data processing operation smoother), we first predicted the next game’s CF60, CA60 and TOI60 for each player based on a lag of 30 previous games, then found that an exponential decay model was a satisfactory single predictor of this. For example, we use the formula

TOI60(new predicted) = 0.14 * TOI60 (this game observed) + 0.86 * TOI60 (this game predicted)

to update the game prediction for TOI60.

UPDATE, 2-25-15: We needed a longer “memory” for CF60 and CA60 events, so these are each

Cx60(new predicted) = 0.04 * Cx60 (this game observed) + 0.96 * Cx60 (this game predicted)


To calculate the teammate and competition statistics for that game, we then take the average of each player’s teammates (and opponents) weighed by the amount of common ice time, as before.

In addition, we’ll be adding the exponentially weighted statistics to our player, team and goaltender history once we establish the best predictive measure for each.

Partnerships and Exchanges

We’ve been busy on the development end here at war-on-ice.com, and that’s led to a number of new initiatives, but more importantly, new partnerships. So we’re pleased to announce three primary partnerships, in alphabetical order:

  • Mike Colligan (@MikeColligan) is our primary source for information on questions about the CBA and the salary cap. We’ll be cross-posting his FAQ questions to the WARblog and a master list. The first three are here:
  • Alexandra Mandrycky (@alexgoogs) has been utterly indispensable in the assembly of the war-on-ice.com player contracts database, and has also been developing upgrades to our charts, which will not only make them more usable and more pleasant, but will also speed up loading time and allow for additional portability. We can’t say enough good things about her contributions to the site so far.
  • Ryan Stimson (@RK_Stimp) is fronting a group of manual trackers as the leader of the Passing Project, who are collecting information on “pass assists” and other pre-shot information. Included in this is the tracking of passes across the line Steve Valiquette has coined the Royal Road, which we will of course think of instead as the Highway to the Danger Zone.

Thanks to these folks for everything they’re doing and will continue to do with us. Give them a follow and help them out if they ask, because they’re making our lives considerably easier and the site all the better for it.

NEW: Defining Scoring Chances

After some consultation, we’ve got a definition of “scoring chance” that is a reasonable one going forward. We’ve deployed it into our site tables for players and teams to test it out.

We need two features to make this work. First, recall our definition of “danger zones” as broken into probability areas:

danger-zones

Second, we’ve empirically tested for higher probabilities within these zones for two types of shots:

  • Rebounds: Any shot that follows within 3 seconds of a blocked, missed or saved shot. All have measurably higher probabilities of success in each of the three zones.
  • Rush shots: Any shot that follows within 4 seconds of any event in the shooting team’s neutral or offensive zones. This is based on David Johnson‘s definition, but the four second threshold gave general and statistically significant increases in probability.

So based on these measures, the average probability of a goal given the type and locations, and the consideration of team defense, we have these conditions for a “scoring chance”:

  • In the low danger zone, unblocked rebounds and rush shots only.
  • In the medium danger zone, all unblocked shots.
  • In the high danger zone, all shot attempts (since blocked shots taken here may be more representative of more “wide-open nets”, though we don’t know this for sure.)

These definitions are flexible but we feel they’re a reasonable starting point given all the data we have available. We’re open to changing it if we have sufficient numerical evidence.


Density Plots for Modern Hockey Statistics (Warning: There’s Math, But It’s Useful Math)

At #PGHAnalytics on Saturday, there was a short discussion about uncertainty in metrics such as Corsi% and Fenwick%.  How can we quantify this uncertainty / variability?  The simplest way to do this would be to include standard errors with each player rating such as Corsi% or Fenwick%, which is a good start.  What else can we do?

Suppose we told you that you could choose between two hypothetical players, and the only pieces of information we gave you about them were their respective 5-on-5 Close Corsi%s from the first 10 games of the season:

Player A:  90%, 70%, 30%, 33%, 50%, 75%, 25%, 80%, 90%, 22%

Player B:  55%, 60%, 44%, 55%, 58%, 63%, 55%, 66%, 45%, 66%

Which would you choose?  Why?

After the jump, we introduce a graphical approach to comparing pairs of players, looking at the distribution of their single-game Corsi%s, Fenwick%s, and much more.

Continue reading