Thanks to Benjamin Wendorf of (among other places) hockey-graphs, we have a collection of historical shot data for skaters from 1967-2013, and for goaltenders from 1952-1982. We can use this to explore the basics of replacement shooting and goaltending under the barest of definitions — the success rate for forwards, defensemen and goaltenders based on shooting and save percentage. What we take from here, we’ll use in the next round with our full database using our refined shot data.
First, we use the Poor Man’s Replacement to mark all shooters with less than 30 shots in a season, and goaltenders facing fewer than 300 shots, as the players whose joint results are our gauge for replacement-value talent.1 We then run these through a binomial model where results are shrunken toward a common mean in each year; the more shots each player has, the closer the result is to the observed shooting percentage. The original estimates of replacement value are a little noisy from year-to-year, so we use a loess smoother to establish an “expected” replacement value over time.
Our estimates over time for replacement shooting are below:
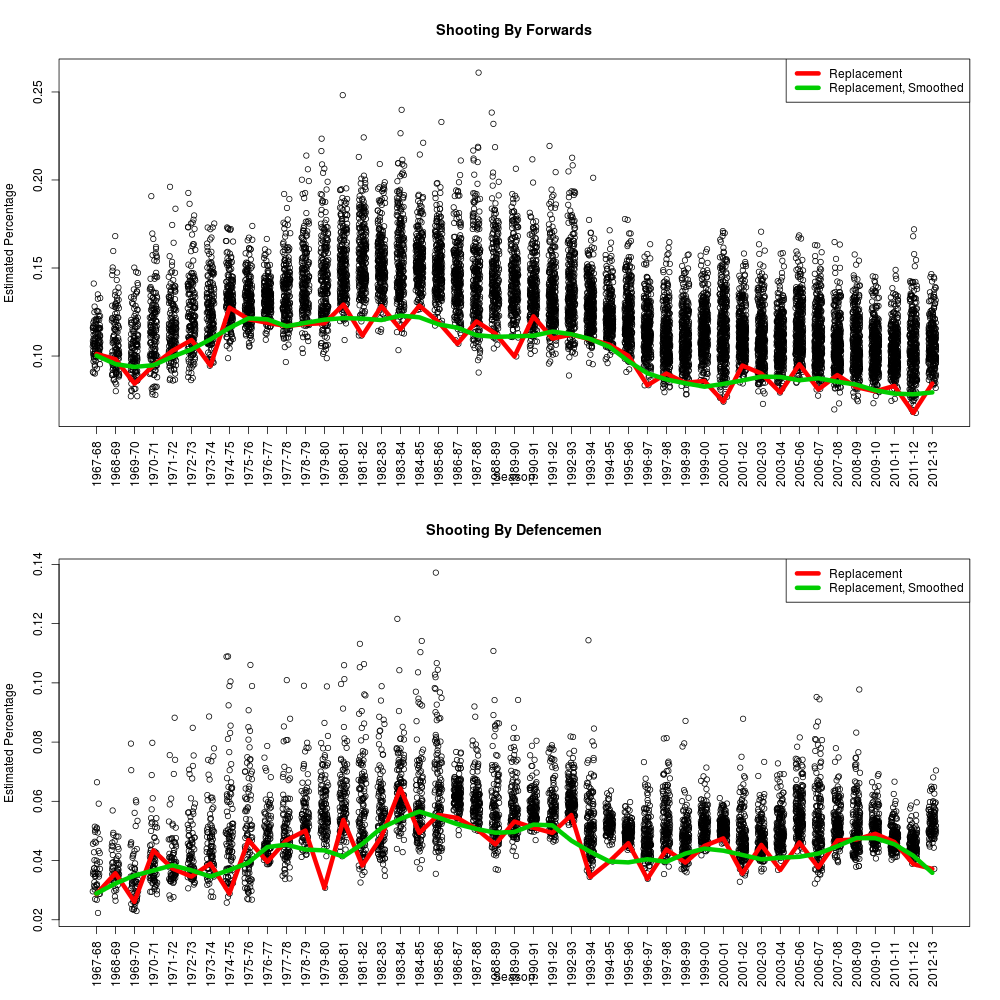
There is a clear elevation in overall and replacement shooting percentage for forwards through the 1980s; there is a more modest but similar bump for defensemen.
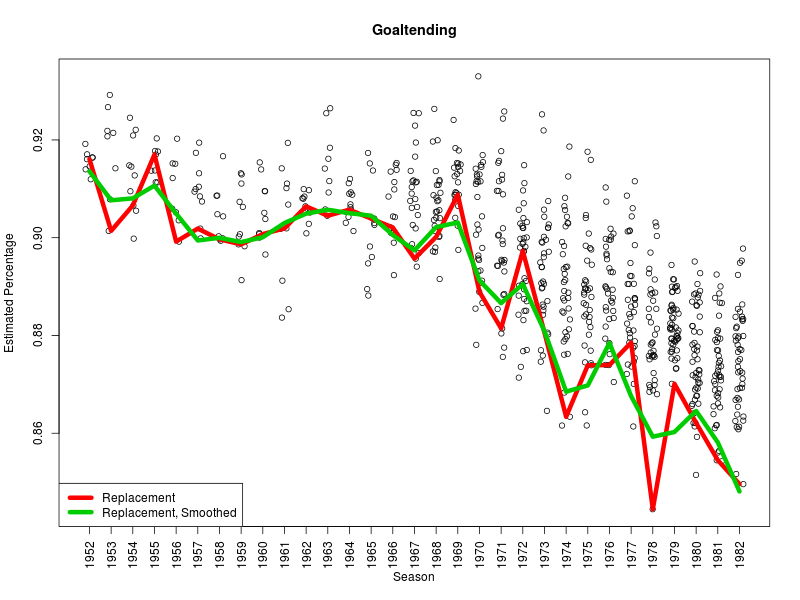
The same pattern is detectable in replacement-level goaltending; the difference is in the effective range of save percentages, which is far smaller than the range for shooters.
Now that we have replacement-level shooting and goaltending, the correction for each player is straightforward — how many goals would a replacement player score/allow on the same number of shots.
We have a reduced table of outcomes posted here for seasonal and total results. Highlights include Lemieux-Gretzky-Gretzky finishing 1-2-3 for goals above replacement in shooting success, though the most impressive result to me is Steven Stamkos finishing at number 8, one of the few high-achieving performances in the Bettman era. Since the goals to wins ratio was higher in that time, converting to pure WAR would yield an even more impressive result.
So why not stick with this method right away? This might be adequate in the long run — and we’ll be checking it with our data as we go — but there are a few opportunities to upgrade on it.
- We know what goaltenders saved what shots; checking the quality of competition is natural.
- We have moderately reliable location data and drop-ins for rebounds and rush shots. All of these factors are known to increase the likelihood of a goal.
- We have game situations and score; even accounting for the danger of the shot, there’s still a change in goal likelihood that we should build in.
- Finally, we ought to test whether or not we can detect playmaker effects or the defensive efforts of the opposing skaters. If these effects are substantial, they should be detectable over long periods of time or in particular subsets of the data.
Links: Top and bottom outcomes by season and overall for skaters and goaltenders.
Pingback: The Road to WAR, Part 10: Modern Goaltending and Shooting | WAR On Ice: The Blog