Preamble: here’s where we start to integrate the pieces of WAR together a bit more. If you want to sneak ahead and look at the results, you can look here for the app being updated regularly.
This is where things get a little more interesting for us. We have a lot more information on the last 12 NHL seasons when it comes to the circumstances of every shot on goal, particularly after Lockout II from 2004-2005. We know the players on the ice, the approximate location of the shot and the shot type, loads of detail that can help us identlfy skill not only for both goaltenders and shooters, but also for the other players on the ice.
This volume of data can, of course, also lead us into trouble if we’re not careful. So bearing in mind that we’re trying to estimate both the talent and performance of players for scoring and preventing goals, we’re going to break this into a few smaller pieces:
- The process of generating shot attempts, at each level of danger, given the skaters for both teams (and not their goaltenders), is temporal and measured in rates. This will be done for skaters in the next post but uses the same approach as in Goals Above Baseline for teams.
- The success of each shot taken, given first the skaters and goaltenders, and if possible, the playmakers and defenders.1
The most important point we’re making here is that we’re conditioning on the fact that a shot was taken. We’re not measuring here the likelihood that a replacement player on an other average team would be in a position to get that shot — that happens in the shot generation piece of our approach.
We’re going to build this in stages to make sure everything is as we expect, and figure out where any surprises might happen before answering the bigger questions.
Game Factors By Danger
We already have a few factors that we suspect are important in the success of a shot, no matter who is doing the shooting or the stopping: the danger of the shot, the score differential, whether it’s the home team, and the man-status of the team (full strength, power play, shorthanded, 4v4 making up the bulk).
To get a range of what to expect, here are the average success probabilities for the last 6 seasons:
| Low Danger | Medium Danger | High Danger | |
|---|---|---|---|
| Down 3+ | 3.22 | 7.63 | 16.91 |
| Down 2 | 3.17 | 7.78 | 18.52 |
| Down 1 | 3.20 | 7.96 | 18.22 |
| Tied | 3.10 | 7.72 | 17.78 |
| Up 1 | 3.35 | 8.22 | 19.10 |
| Up 2 | 3.35 | 8.88 | 19.58 |
| Up 3+ | 3.42 | 8.78 | 19.43 |
| Even Strength | 2.74 | 7.01 | 16.97 |
| Power Play | 6.66 | 12.22 | 21.87 |
| Shorthanded | 2.00 | 6.31 | 18.20 |
| 4v4 | 3.11 | 8.02 | 17.24 |
These adjustments are significant, particularly when we see the huge jumps in power play success probability over the other categories. An average player should do well in these situations; we should expect that even a replacement-level player should have a substantial success rate when placed in this position.
Approach
We have our basic approach from our previous look at historical shooting and goaltending:
- Establish the model for goal scoring that uses game factors, goaltenders and shooters.
- Establish the marker for what replacement-level talent would be for these positions.
- Compare the achievement of the player in question to what the replacement player would have achieved in their place. This means incorporating the abilities of the other players involved, so that goals against good goaltenders will effectively count for more.
The trick here is that we now have to take more into account when it comes to replacement: we’re estimating at least two replacement levels simultaneously and in opposition to each other, for every unique situation. And unlike in faceoffs, the stakes are considerably higher since small adjustments in replacement level talent could mean large differences in apparent relative performance.
Fitting The Model
For this analysis we’re going to use multiple logistic regression with partial pooling on each of our groups of interest. We started by fitting the model for the game factors as listed above; for each subsequent group we’ll fit the standard model to estimate baseline performance, and then we’ll choose a penalty factor to reduce our estimate effect sizes through cross-validation to maximize the degree to which our estimates predict out-of-sample performance. We use this to estimate talent levels; we then use the replacement player talent as the baseline to establish each player’s goals above replacement.
Shooting
The first thing we notice when we use the Poor Man’s Replacement to find the performance of a replacement level player is that the break isn’t very clear; that is, controlling for all the factors above including the danger of the shot, and the position of the player, we get a replacement level that’s only slightly below the rating for the average shooter, for both forwards and defensemen. Take danger out, though, and the gap between replacement and average becomes clear:
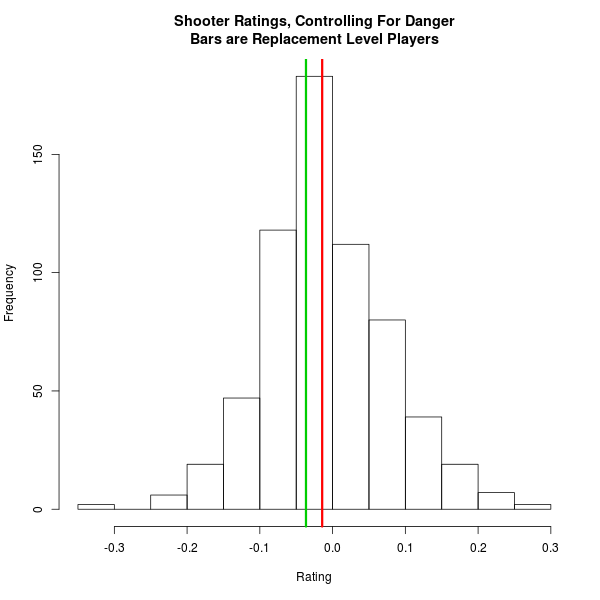
If we incorporate danger into our estimation of “replacement”, we get a talent level (and performance) that’s almost the same as average. This doesn’t at all mean that the skill doesn’t exist — far from it, we’re clearly identifying it — but that teams don’t seem to select for it when choosing their players, compared to the edge gained in shooting due to danger alone.
We fit this model for the 10 seasons, within each of the three danger zones, from 2005-2006 to 2014-2015, for all players with at least 15 shots in the particular zone. All results are available at this app.
The top season for shooting above replacement belongs to Steven Stamkos in 2011-12, with 19.6 GAR; in third place is Alex Ovechkin with 17.0 GAR in 2007-08. In a surprising second is Brad Boyes with St. Louis in that same 2007-08 season with 19.4 GAR. How is it that someone with a 43 goal season could appear better than Ovechkin, who had 65? The simplest example is that a player in Ovechkin’s position had more power play shots and against weaker goaltenders. This difference will show up in the component for shot rates if so.
Goaltending
From the previous part: we also want to check that adjusting for danger doesn’t affect our estimates of replacement level. Sure enough, it doesn’t appear to in this case. Here’s one season worth of data to demonstrate:
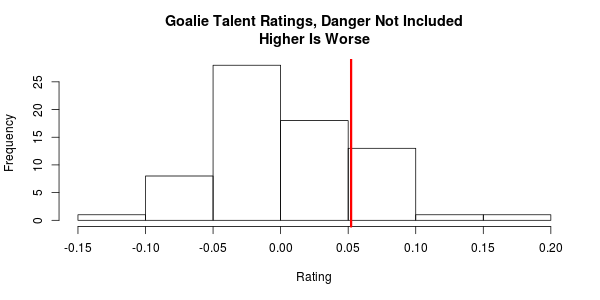
Since they face a much larger number of shots per person, it’s not surprising that goalies have a much bigger total when it comes to their goals above replacement. In fact, 51 player-seasons for goaltenders have more GAR than Stamkos’s shooting record season. Tim Thomas owns the top two spots by himself. This season’s top goaltender, Carey Price, currently owns the 10th place spot for this year’s body of work, but he’s easily in striking distance of 6th before the season ends.
Playmaking and Defending (Soon)
So here’s the issue: if we can measure the impact that shooters and goaltenders have on goal probabilities, what’s to stop us from adding the impact of the other players on the ice — playmakers for the offense, defensive stoppers for the defense?
Nothing but the quality of the data. These players can certainly contribute to the rate at which shots of each danger happen; establishing the talent level for players in changing the probability of a goal given that a shot has happened works exactly like the other skills: see how much the probability of scoring a goal goes up (or down) when each player is on the ice, and adjust it so that the value is as predictive as possible over the rest of the time.
We’re not ready to release full results of this yet, but there are three main points to be made:
- There is a distinct, non-zero effect for playmaking and defending for each player for each level of danger.
- That effect size is really small compared to the effect of the shooter — about 1/5 to 1/3.
- Just like the shooters, the replacement-level ability for playmaking and shot defense is indistinguishable from average.
First we’ll be covering the effects on shot rate for each player, which as we’ve discussed is a much clearer indication of playmaking or play-stopping skill. Once that’s done, we’ll swing back and get the shot alteration numbers to complete the set.
Pingback: The CBJ Tomorrow: The Backup Goalie - BS Hockey