It’s been a busy time here at war-on-ice.com, and we haven’t had as much time to do anything with regard to our stated primary mission — the creation of an all-inclusive Wins Above Replacement measure.1 So it’s about time we went back to our roots and provided a coherent framework on which we can move forward.
In the next week we’ll be releasing our proposed three main elements from which we can derive WAR using the data we have, in what we feel is the ascending order of importance: faceoffs, shooting/goaltending success, and shot attempt rates.2
For each process, the pathway we’re laying out to establish value sounds straightforward:
- Measure the relative value of a particular skill or event in the game.
- Establish what a replacement player would have done in this place according to a standard rule.
- Convert this value to goals.
- Convert goals to wins, which is a measure that can change from season to season.
We’ve been talking about parts 1, 3 and 4 in previous entries in this series, and we will continue to do so in the parts to come. But we need to establish what “replacement” means, because there are two important qualities we need to factor in.
First, there’s the standard definition: a level of performance against which we judge everyone else, under the assumption that it’s the level of skill that a team could purchase at the league minimum price. This is fairly clear-cut in most examples in, say, baseball: for every position, there’s a different baseline expected level of performance, and the average can be calculated at each position by that standard; replacement level can then be calculated relative to the average. A shortstop that hits 20 home runs in a season is more valuable than a first baseman with the same numbers, because “replacement-level” shortstops will tend to have less power.
But a benchmark for performance isn’t sufficient here. When we measure team achievement, we simultaneously adjust for the strengths of their opponents to get a more precise estimate. To do the same thing for player-player interactions, we have to adjust for player strengths, but since estimates for replacement players are inherently unstable — there’s so little data on each player, almost by definition — it helps us even more to have a single standard for each type of replacement player to ensure that our adjustments are accurate.
One standard definition that I like for replacement players is based on the total number of regular players in the league, like in the Baumer-Jensen-Matthews OpenWAR method: for 30 teams with 25 regular players, any player beyond the original 750 can be considered “replacement”. This makes sense if players have only one or two roles, like fielding and batting. Where this differs in hockey is that a replacement player at even strength would come from the minor leagues, but a replacement player on the power play might be a regular roster player promoted from the third line, and so establishing an exact count of players in those other roles may prove more difficult.
For this reason, let’s test out what I’m calling the poor man’s replacement: for the statistic in question, set a threshold value for which all players under get pooled together as the canonical “replacement” player. Let’s test this with a standard model for faceoff ability. A modified Bradley-Terry model can be built into a logistic regression model; for every faceoff between players A and B, when player A is on the home team, we get the model
log (Pr(Player A wins) / Pr(Player B wins)) = home_bonus + R_A – R_B
In this case there are two classes of replacement: centers, for whom faceoff skill is expected as part of the job, and non-centers, typically brought in as a second choice for the faceoff following the designated taker being tossed. [UPDATE, 2015-03-23: The current value being used for a replacement threshold is if a player takes fewer than 50 faceoffs in a season.] We fit this model for the home-ice advantage, every non-replacement player, the replacement center and the replacement non-center, for all 12 seasons in the war-on-ice.com database — this is 889,733 faceoffs total as of Saturday March 21, 2015.3 The results are fairly consistent across all 12 years for these main factors:
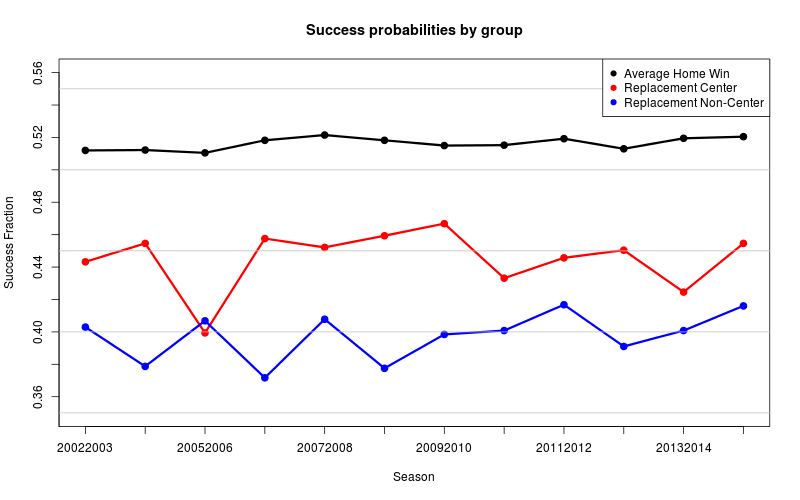
We now have terms for each player in each season that estimates their individual strength over all events. This calibrates the model for the next step: calculate the number of faceoffs that the appropriate replacement player would be expected to win against the same opponents (and home vs away); an average player would only beat Patrice Bergeron 40% of the time, or a non-centered replacement over 60% of the time, and a replacement center would be less likely on either (roughly 32% and 53% each). We then calculate Faceoff Wins Above Replacement by subtracting this number from their actual win total.
Converting Faceoff Wins to Goals
Now that we have a measure of faceoffs won against replacement, the simplest conversion into goals is to take a direct conversion factor from one to the other. My earlier estimate from a small, biased sample of college hockey gives about 0.015 goals per faceoff won; Schuckers’ group used a similar method to calculate NP20, and their estimate is 1 goal per 76.5 faceoffs won, or 0.013 G/W. We can narrow this estimate by location and man-situation if necessary using similar adjustment factors, though we prefer to treat all faceoffs as fungible so that coach’s usage, or differences in team scoring abilities, do not play a direct role.
Overall Results
We link below to the season-by-season and total results in their own Google spreadsheets; they’ll be added to the main site after this alpha period. The top producer above replacement is Patrice Bergeron, with Joe Thornton close behind; more interesting to me is that Rod Brind’Amour performed nearly as well in only 7 seasons of our data that the others did in 11 or 12. Brind’Amour also owns the best season on record with 6.64 goals above replacement in 2005-06. That’s probably being driven in part by the low level of replacement quality in that year, but it would likely still stand up due to the sheer number of faceoffs he took.
It should be pointed out that we didn’t necessarily need the more elaborate Bradley-Terry model; just using the Poor Man’s Replacement with individual win-loss records and home/away counts yields nearly the same results. But it’s just as important to show that the slightly more complex method will work in new situations without making too many unusual assumptions.
Links
Pingback: The Road To WAR, Part 8: Penalties Taken And Drawn | WAR On Ice: The Blog