Note: This is a quick detour from the original plan, but it illustrates one of the most apparent difficulties that we’re facing in this task: the changing nature of data over time. Plus, it’s quicker than the others.
How valuable is a penalty drawn or taken to a team? In goals, the marginal effect is clear: you get up to 2 minutes during which your scoring rate for goes up and the rate against goes down. And if it’s your best penalty killers who are penalized, they don’t get to help clean up the mess they’ve made in the process.
The secondary effects are less clear. For example, what changes in terms of a team’s future effort when a player takes an ill-advised penalty? We’re not in a position to answer this when it comes to the share of responsibility to the penalty taker; we can only assess a team’s performance during those times.
And so, for the time being we’re left with the credit and blame for the penalty taker and drawer in terms of an expected goals measure. To get goals above replacement, we need to know the rate at which a replacement player at each position would take or draw penalties — aside from misconducts and matching fighting majors — so we do this in the same type of method as with faceoffs and the Poor Man’s Replacement method:
- Pick a threshold below which we consider a player to be replacement level. For this demo we consider this to be three full games, or 180 minutes of ice time.
- Establish placeholders for forwards and defensemen alike.
- Fit a model to establish the most likely rate at which each player (including the replacements) takes and draws penalties. We use a Poisson model for the rate with regression toward the mean for the group.
The results for the 10 seasons since 2005 are below. Note that we do not have penalties drawn in the 2005-06 and 2006-07 seasons.
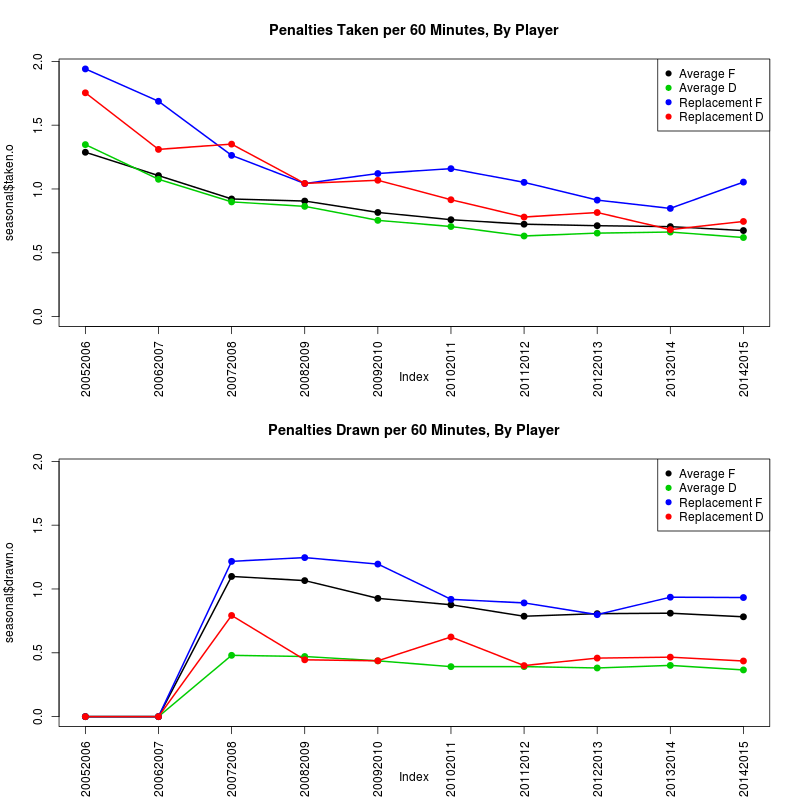
The “replacement” rate for taking penalties for forwards and defensemen is higher than the league average. When it comes to penalties drawn, forwards draw penalties at a greater rate than defensemen, which is to be expected on scoring plays; replacement rate at each position is roughly the same as the league average otherwise. This suggests that if drawing penalties is a skill, it’s exceptionally rare, whereas general discipline to avoid taking penalties is clearly a behaviour seen in full-time players.1
Now it’s simple enough to get the number of penalties drawn and taken by replacement players at each position, and subtract this from their actual results. The final table is available in full here.
We convert to goals with an approximation: A team on the powerplay scores at a clip of roughly 6.5 goals/60 and allows 0.78 shorthanded goals/60. We move each of those rates from a 5v5 rate of 2.5 goals per 60 minutes, and assume that 20 percent of powerplays end in goals, for an average of 1.8 minutes on the PP, and reach an average figure of 0.17 net goals per penalty taken or drawn. For now we use the relation that 6 goals equals one win.
The champion in total penalty WAR in total volume in the last 10 seasons is Dustin Brown, and it’s not even close: 8.47 wins above replacement for Brown in that time. Per 60 minutes, though, he’s the third ranked player in the top 50 over that time; Nazem Kadri and Darren Helm take the 1 and 2 spots.
The special prize here goes to Patrick Kaleta of the Buffalo Sabres, who has a penalties drawn rate well above the average and in the number one spot for the top 200. We know this about him already but it helps his case that he has a penalties-taken rate that isn’t as bad as a replacement player and gives him an extra boost.
Links:
- R code and data for replication.
- Seasonal and overall result tables.