Note: If you haven’t yet read our post on how SCF% better predicts future GF% than does CF%, we recommend reading that first. The definitions of metrics, data used, and methodology used in this post is the same as what is written here, so we refer interested readers to there for more info.
Summary: This is an update to our previous post on the best metrics for predicting player performance. Here, we split the analysis out by position (forwards vs. defensemen).
In this analysis, using all data going back to the 2005-06 NHL season:
- For forwards, SCF% is the best predictor of future GF% of the metrics we tested
- For forwards, CF% is a better predictor of future GF% than is FF%, but for defensemen, the opposite is true.
- For defensemen, FF% is the best predictor of future GF% (with SCF% finishing a close second) of the metrics we tested.
- SCF% is a much better predictor of future GF% for forwards than it is for defensemen.
- In general, future GF% is more accurately predicted for forwards than it is for defensemen.
Glossary: See here.
Data: See here, and add FF% = Fenwick For% = percentage of unblocked shot attempts directed at the opposing goal when a player is on the ice.
Methods: See here, and add FF% to the list of metrics evaluated. (Note: In our original analysis, we also evaluated FF%, but it was found to be worse than CF% and SCF%, so we did not include it in our post.
Results — Past-vs-Future Correlations:
For forwards, SCF% had the highest past-vs-future correlation with future GF% across all seasons in this analysis. Here are the results (in order of correlation magnitude):
- cor(past SCF%, future GF%) = 0.348
- cor(past CF%, future GF%) = 0.332
- cor(past GF%, future GF%) = 0.331
- cor(past FF%, future GF%) = 0.316
For defensemen, FF% had the highest past-vs-future correlation with future GF% across all seasons (with SCF% finishing a close second) in this analysis. Here are the results (in order of correlation magnitude):
- cor(past FF%, future GF%) = 0.285
- cor(past SCF%, future GF%) = 0.282
- cor(past CF%, future GF%) = 0.277
- cor(past GF%, future GF%) = 0.198
Results — Future | Past Regression Models (all seasons):
For forwards, we used past SCF% and past CF% as explanatory variables in a multiple linear regression model of future GF% across all seasons. The results of this model are summarized here:
- Past CF%: Coefficient = 0.2063, p-value = 0.0223. Note, this coefficient is similar to what was found in the all-positions regression from our previous post (0.2227).
- Past SCF%: Coefficient = 0.4856, p-value < 0.0000001. Note, this coefficient is increased from what was found in the all-positions regression from our previous post (0.4067).
- Both SCF% and CF% have statistically significant associations with future GF%.
- Interpretation: For every one-percentage-point increase in SCF%, future GF% is expected to rise by about 0.49 percentage points, holding all other variables constant.
- Interpretation: For every one-percentage-point increase in CF%, future GF% is expected to rise by about 0.21 percentage points, holding all other variables constant.
Interestingly, the magnitude of the SCF% coefficient increased for forwards, indicating that SCF% is a better predictor of future GF% for forwards than it is for defensemen in this analysis.
Note that we also repeated this analysis using FF% instead of CF%, but FF% was found to have an insignificant effect on future GF% when accounting for SCF% in the model (results not shown). This is very interesting: CF% was found to be significant even after accounting for SCF%, while FF% was not. This may indicate that the additional information included in CF% — blocked shots, for and against — is driving some of the metric’s predictability of future GF%. Our hypothesis is that blocked shots against (i.e. shot attempts taken by the opposition at the player’s goal) are driving the effect here, since forwards do a lot of shot-blocking at the points in the defensive zone.
For defensemen, we first used past SCF%, past CF%, and past FF% as explanatory variables in a multiple linear regression model of future GF% across all seasons. Since CF% and FF% are highly collinear, we opted to do two separate two-explanatory-variable regressions and examine the results: (1), future GF% given past SCF% and past CF%, and (2), future GF% given past SCF% and past FF%.
The results of the first model, which models future GF% given past SCF% and past CF%, are summarized here:
- Past CF%: Coefficient = 0.2230, p-value = 0.02705. Note, this coefficient is almost identical to what was found in the all-positions regression from our previous post (0.2227).
- Past SCF%: Coefficient = 0.3114, p-value = 0.00282. Note, this coefficient is decreased from what was found in the all-positions regression from our previous post (0.4067).
- Both SCF% and CF% have statistically significant associations with future GF%.
- Interpretation: For every one-percentage-point increase in SCF%, future GF% is expected to rise by about 0.31 percentage points, holding all other variables constant.
- Interpretation: For every one-percentage-point increase in CF%, future GF% is expected to rise by about 0.22 percentage points, holding all other variables constant.
In other words, SCF% has a more substantial effect* on future GF% than does CF% in this analysis.
The results of the second regression model, which models future GF% given past SCF% and past FF%, are summarized here:
- Past FF%: Coefficient = 0.2993, p-value = 0.00417
- Past SCF%: Coefficient = 0.2495, p-value = 0.01713. Note, this coefficient is decreased from what was found in the all-positions regression from our previous post (0.4067).
- Both SCF% and FF% have statistically significant associations with future GF%.
- Interpretation: For every one-percentage-point increase in SCF%, future GF% is expected to rise by about 0.25 percentage points, holding all other variables constant.
- Interpretation: For every one-percentage-point increase in CF%, future GF% is expected to rise by about 0.30 percentage points, holding all other variables constant.
Interestingly, SCF% is less predictive of future GF% for defensemen than it is for forwards, and FF% is the superior predictor of future GF% for defensemen by a small margin in this analysis.
Season-to-Season Past-vs-Future Correlation Plot, Forwards:
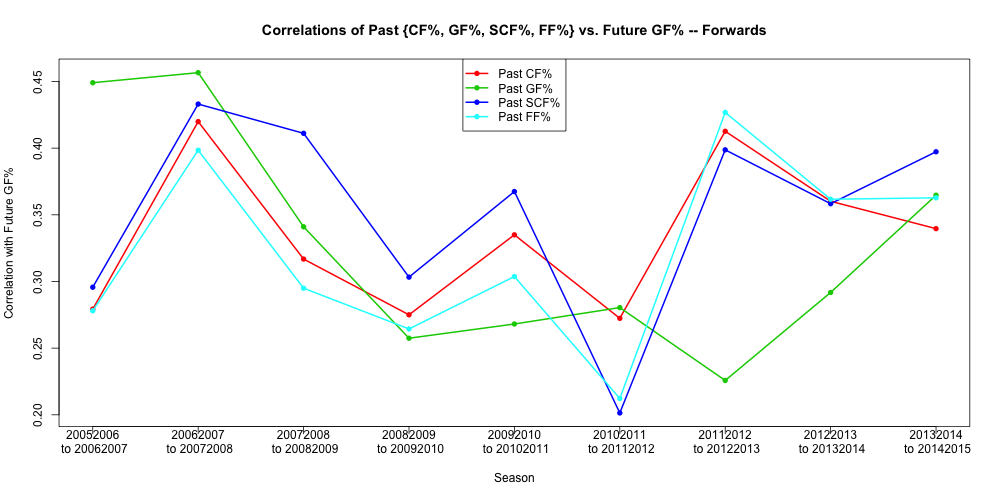
Season-to-season, the metric with the highest past-vs-future correlation for forwards varies. Recall that across all seasons, SCF% has the highest past-vs-future correlation. This seems to be backed up by the graph, where SCF% is highest by a relatively large margin in 4 of 9 seasons.
Season-to-Season Past-vs-Future Correlation Plot, Defensemen:
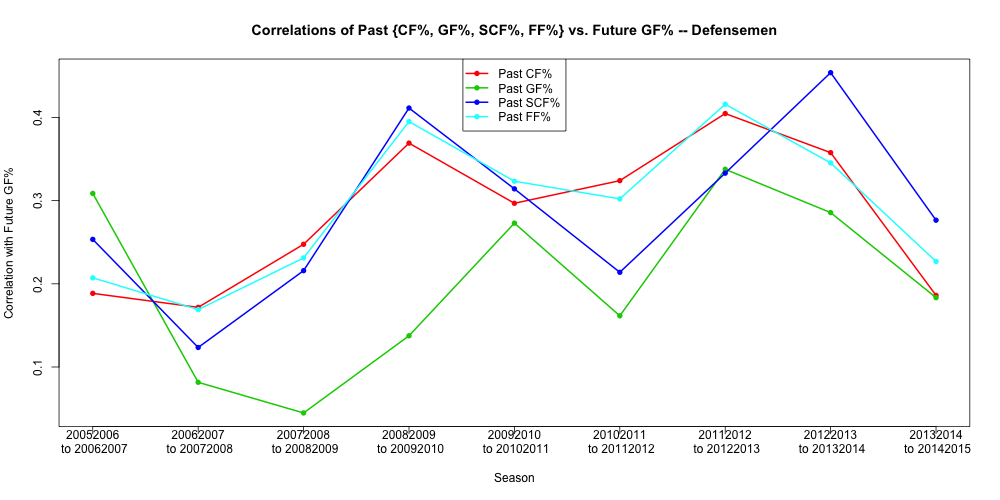
Season-to-season, the metric with the highest past-vs-future correlation for defensemen varies quite a bit. Recall, though, that across all seasons, FF% has the highest past-vs-future correlation. This seems to be backed up by the graph, where FF% appears to be a bit more consistent from season to season than other metrics.
Notes:
- *Since SCF%, CF%, and FF% can all be approximated with a Normal(mean = 50%, standard deviation = 10%) distribution — that is, they are on the same scale — we can directly compare the magnitude of their regression coefficients.
- Similar to our last post, one thing we found interesting is that in these multiple linear regression models across all seasons, both SCF% and CF% / FF% (whichever was used) had significant coefficients. In these analyses, it’s common for only one independent variable to explain most of the variance in the dependent variable (due to collinearity). The fact that both are significant indicates that SCF% and CF% / FF% are accounting for (at least slightly) different parts of the variance in future GF%. Predictive models of player performance would do well to include both metrics, regardless of player position.
- Is future GF% the metric we should be using to evaluate forwards? Defensemen? If not, what should we use? We used future GF% since that seems to be the standard in predicting future player performance. That said, we’re open to suggestions here, and we’ll happily update our analyses depending on what the community thinks.
- We removed Brett Burns and Dustin Byfuglien from these analyses, since their positions changed from season to season. If there are other players who we should remove, please let us know!
Pingback: Panthers' Ekblad has exceeded expectations, but it wouldn't have happened without Campbell - The Sweaty Jock