Note: This is part two of a series of guest posts written by @MannyElk. In the first installment of Hockey and Euclid, Manny outlined the player similarity calculation used in the Similarity Calculator. The explanations to follow will assume knowledge from that article, so we urge anybody who wishes to understand the derivation of the Bombay function in detail to get caught up.
We at www.war-on-ice.com are happy to host Manny’s newest Bombay Ratings App! We continue to encourage others in the hockey research community to follow Manny’s lead and develop public applications that will further the frontiers of research in hockey analytics.
While working on the Similarity Calculator, I stumbled upon a study in which Euclidean distance was used to compare NBA players to Michael Jordan. The author used the distances to generate a list of the most similar players to the man most would agree is the best ever. From this idea, Bombay ratings were just a conceptual hop, skip and jump away. Instead of choosing my own Michael Jordan from a list of historical players, I invented one.
Gordon Bombay (no relation to the legendary coach) played two seasons in the NHL. In his first season, as a forward, he led the league in every single statistical category and eventually his team to the Stanley Cup. Seeking a challenge, Bombay converted to defence in his second season. Undaunted, he repeated his rookie season success, once again unmatched by his peers in every single facet of the game. Bombay promptly retired, and no player since 2005 has been able to surpass his accomplishments.
Bombay’s stats at either position are equal to the best recorded values among regular skaters at that position since the 2005-2006 season. Thus, he possesses the best stats we can imagine without stepping outside the boundaries of what real players have been able to accomplish1. If you don’t wish to entertain hypotheticals, consider an alternative explanation: The similarity calculation evaluates “distance” between players, each occupying a position in imaginary space2. This space has as many dimensions as there are categories by which you choose to compare players, and the limits of each dimension are set by the maximum and minimum recorded values since 2005-2006. Gordon Bombay is simply a marker we’ve decided to place at the positive-most position in space — the position where the positive extrema of each dimension meet. In a three-dimensional plot, this is simply a corner. The Bombay Rating is the similarity between a player and Gordon Bombay.
Hence, we’ve laid the foundation for a method by which we can easily evaluate how “good” a player’s stats are that is surprisingly flexible and reasonably effective at producing intuitively pleasant results. The Bombay function essentially does what we all do when we pull up a player’s statistics. The advantage is that it’s more precise, quicker, and returns a single number. Recall that the similarity calculation is a function of the chosen dimensions and corresponding weights. It follows that the Bombay is function of those same variables. While this permits fluidity in what can be accomplished by the method, it also makes it entirely dependent on the quality of the measures used.
The Bombay app I developed uses a variety of 5v5 stats to assign ratings to skaters based on the selected weights and generate charts comparing players to Gordon Bombay in each of the chosen categories.
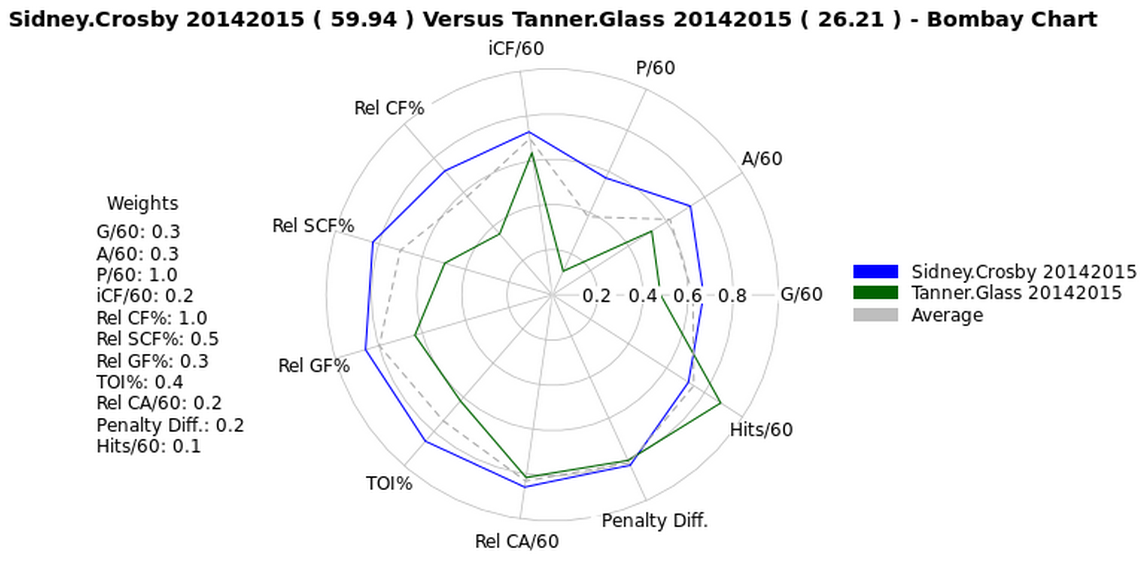
(click to enlarge)
The outer edge of the chart represents a 100% similarity to Bombay in that measure. This is only achieved if a selected player-season possesses the best recorded value in that metric among regular skaters since 2005. The dashed grey polygon represents another fictional player – one whose stats are all equal to the league average for regular skaters at that position. Note that league average does not signify a 50% similarity. At the default weights, this hypothetical average forward has a Bombay rating near 46 and the defenceman, 45.
I should confess that the default weights are largely arbitrary. I believe the correct weights to use are case-dependent, and I certainly encourage users to assign their own3. I’ve found that using the “Defence” preset weights as a starting point to evaluate bottom-six or defensively-oriented forwards often produces more agreeable results. Individual season rankings can be viewed by toggling the “Table” tab and further filtered using the inputs at the bottom of each column. Using preset weights, the names atop the Forward rankings (Ovechkin, Sedin, Jagr, Crosby, Zetterberg, Malkin, Sakic) are who you’d expect; Defencemen, to a much lesser extent (Visnovsky, Karlsson, Giordano, Byfuglien, Campbell, Niskanen, Weber). It’s no secret that the evaluation of defencemen, by analytical and traditional methods alike, leaves to be desired at times. With better measures of defensive ability will come better results by this method.
Bombay ratings can easily be computed using aggregate player stats. You can view career Bombays here. While I wouldn’t necessarily trust default Bombays to provide a single number indicative of player quality over metrics like WAR and GvT, I believe the method has very interesting potential and flexibility. For one, it can easily be expanded as new stats become available. Secondly, the same method can be applied in other leagues, namely Canadian Major Junior and college leagues.
Pingback: GUEST POST: Hockey and Euclid — Introduct...
Pingback: Season Review: Nathan MacKinnon | Objective Avalanche