This is the big one that drives most of what we see in the game, but is also the most difficult to calculate directly: how would the shot rates for and against a team behave if we swapped out a player with their equivalent replacement?
First, here’s the progression in methods that we’ve seen so far:
- Good old plus-minus (+/-), which no one seems to think is good but everyone agrees is old. It was the number that was used for the longest time to capture supposed relative defensive ability, but among its flaws are that it’s too dependent on goaltenders, too dependent on linemates, and the sample sizes are too small to produce a strong signal. Relative plus-minus doesn’t have the first problem, if the only job is to compare against one’s own teammates, but can still suffer with too much common time with other players.
- Corsi/Fenwick/Bowman1 numbers take away the impact of the goaltender and of shooting skill, in favor of at least a tenfold increase in sample size. They add in contributions from usage like zone starts which can now be detected statistically and still have the linemate and competition problem.
- Regression-adjusted statistics for shot differential; see our comprehensive historical list here, then add in Stephen Burtch’s dCorsi and Domenic Galamini’s Usage-Adjusted Corsi. Essentially, make adjustments to the macro-level stats depending on whom they played with and against.
You could hypothetically drop in any of the above pieces and spin them into a measure of goals; the conversion than can be slotted along the other contributions to get a total value. But we have a few other needs:
- We want to adjust for teammates and competition simultaneously, including replacement level players.
- We need to separate offensive and defensive contributions.
- We adjust for usage, including whether a faceoff was won or lost, and score situation.
- We model separately for each shot danger, because we know that forwards and defensemen contribute differently between and within these groups.
- We also want to distinguish between performance (what happened) and talent (what would be most likely in future).
We start with the model we proposed in our 2013 paper and demonstrated in Part 5 for teams. We start by measuring the rates at which low, medium and high danger shot attempts are recorded, adjusting for home status, score differential and zone starts/faceoff wins. This gives us the baseline rate for events in every situation and gives us a place to start.
What we do next is straightforward to describe but a little more difficult to execute. In relative statistics or WOWY analysis we attribute a player’s ability as the change in the team’s shooting rates, for and against, due to their presence and absence in the play. And that’s exactly what we do — for all players on the ice, simultaneously, by finding the set of ratings that best describes the rates for which all events occur. In this case, each player’s ratings multiply the expected shooting rate by some factor, compared to an average player in the same position; greater than 1 increases scoring for or against, less than 1 depresses it. We use penalized maximum likelihood estimation to do them all at once; the penalty is determined by cross-validation so that these estimates will be predictively valid.
First, though, we need to estimate our replacement-level for forwards and defensemen. We use Poor Man’s Replacement for this as part of our fitting strategy; for now we categorize a replacement player at 5v5 as someone with fewer than 180 minutes of ice time (though this is open to change). Here’s what we found for each danger (unsmoothed for now), for each season from 2005-06 to the current one:
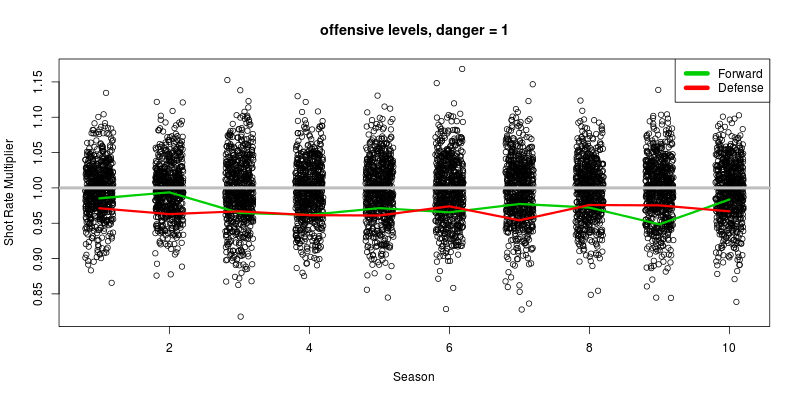
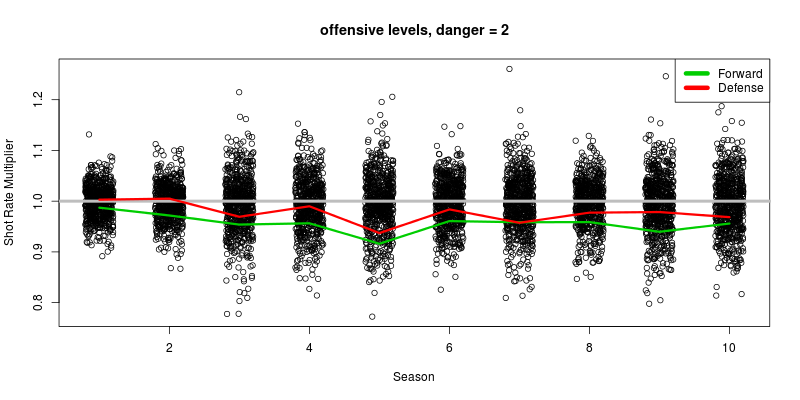
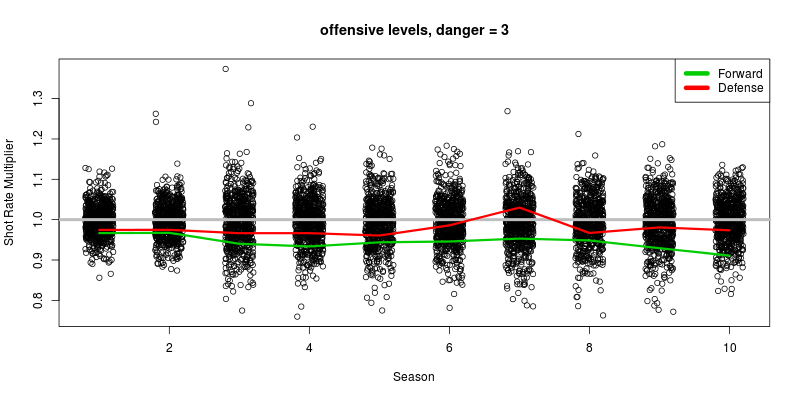
For “scoring chance” shots, with medium and high danger, replacement level for forwards is measurably less than it is for defensemen in terms of relative ability; it’s just about a wash for low-danger shots. How about for defensive play?
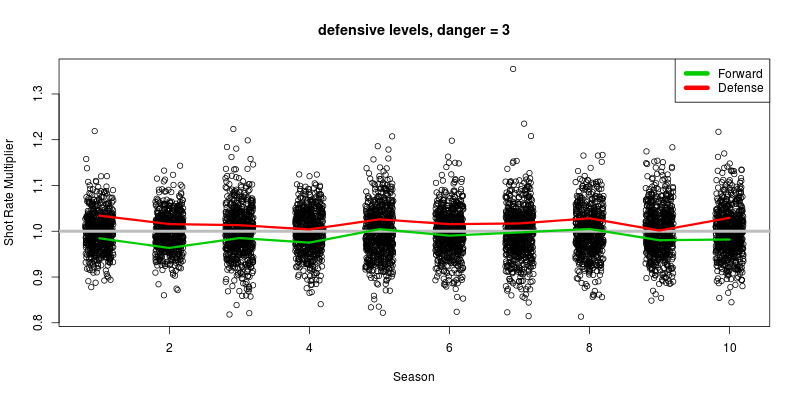
Replacement-level defensemen have marginally worse shot suppression than the average; replacement-level forwards, slightly better. From this, we submit that teams are selecting at least some of their offensive talent based on shot rates, but not their defensive talent, and that it might be acquired cheaply if carefully scouted.
Now we have these measures to stabilize our estimates, we have an expected outcome for every single shift based on these player ratings. This already suffices to estimate talent; to estimate performance, free of these confounding factors, we calculate what was most likely to happen if play were repeated, and subtract this from the actual outcome for each player, and multiply each outcome by the expected shooting percentage — in this case, Corsi shooting percentage by danger — to yield an outcome in goals for an average shooting team.2
We do the same thing for power plays and penalty kills to measure how many shots of each variety are recorded by each unit. The trick is that “replacement” now means something else; it’s not a minor league player, it’s an NHL third- or fourth-liner who’s been promoted into this role, which is why Poor Man’s Replacement is ideal for this; we use 30 minutes of ice time to designate the replacement threshold for each setting, and 5 minutes for 4 on 4.
Our complete seasonal database, accessible here, now has a complete breakdown of our estimates for shot rate WAR, for and against, in each man situation for each player season. This is where the skaters show up: their ability to drive “possession” play is what makes up the bulk of their value, particularly offensive value given the lower replacement threshold.
Some noteworthy features:
- Top spot for a player-season goes to Pavel Datsyuk in 2007-08 with 35.7 GAR; he’s followed up by teammate Henrik Zetterberg with 28.9 in the same season. The power play drove almost as much as 5v5 offense for both players, but Datsyuk gets the edge largely due to his work on the PK.
- Top defenseman on the list is Scott Niedermayer in 2005-06, driven twice as much (!) by the PP as by 5v5 offense. But 5v5 defense is also boosting his case.
- Top defensive performance? Zdeno Chara, 2009-10, 11.13 GAR. But this is a season with more goals than 2013-14, when Anton Stralman had 11.11 GAR; deflation is going to push Chara down when we convert to wins.
- Had to double take: David Clarkson, 2011-12, 9.11 defensive GAR, good enough for 19th overall best player-season. Then I remembered he was with the Devils and that they all get a Lou bump, which is why he’s the fourth-ranked Devil on the list behind 13-14 Andy Greene and 11-12 Mark Fayne and Dainius Zubrus.
Please let us know if you spot anything else noteworthy or fishy with the data; we’re fairly confident in what we’ve found so far but there are sure to be a few surprises.
Pingback: Pre-Game Skate (4/9/15): Boston Bruins (41-26-13) @ Florida Panthers (36-29-15) | The Sunshine Skate
Pingback: examining wins above replacement in the nhl | hi, this is dom
Pingback: What's Next for War-On-Ice - Today's Slapshot
Pingback: Paul Bissonnette is Wrong and Right | Hockey Graphs