We’ve recently been integrating a lot of new data into the site, with more to come. But we have some major changes to announce as things move forward.
1) The big one: we now have x,y data for all shot attempts going back to the 2005-2006 season as obtained from the ESPN feed. We note that since a fraction of games didn’t have GameCast information, we had to stitch it together a bit by imputing locations, taken by matching the distance of the unknown shot to another taken by the same player of the same type. This got particularly interesting when looking at buildings that didn’t seem to have any tracking within a season — Montreal in 2006-2007 — but it’s as good as we’re going to get right now, and far better than we had before.
This means that we’ve immediately extended Hextally back to 2005-2006, and augmented it with all shot attempts, blocked and unblocked. (Goalie Hextally just has saves and goals as before.) You’ll see some more features with this data being rolled out soon.
2) We made a tweak to our three “danger zones“, including facetiously naming them as such. (UPDATE, 2014-12-10: Apparently a similar name has been in use for years in soccer, so we can’t even take real credit for an idea that filtered through to us via Fangda Li.) The high slot range now reaches above the home plate line, and the “center point” is now considered low danger. Here’s one such map with numbers for the Kings this season:
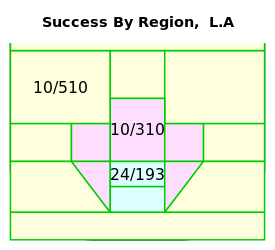
This lines up better with goal probabilities in each zone.
3) We’ve simplified our rink adjustment factor to operate on distance. For each rink in consideration, we compare the cumulative distribution functions (CDFs) of shots for that team at home vs. that team away, in two groups only (slap shots and non-slap shots), and change the distance of a shot in a building to match its position on the other CDF. So if a shot was at the median distance of 25 feet at Madison Square Garden, and the median for all shots involving the Rangers away was 28 feet, the distance would be so adjusted. The (x,y) coordinate is changed by maintaining the angle from the center of the net and stretching out or shrinking in.
This is a precursor to a better system to be deployed at a future date, but for most of our purposes, it’s distance deflation that causes problems in these models, and as you can see from the danger zone chart, distance is roughly concordant with zone.
4) We got rid of “close” measurements. There were reasons for this:
- It’s less predictive of future behaviour than unadjusted but full data. Particularly the drag on scoring in tied games near the end of regulation.
- We’re going to be adding score-adjusted measures soon, which are better for that.
All in all, there’s more on the horizon that we’re committing to. Stay tuned.
Pingback: The Road To WAR, Part 6: Rate-Based Event Adjustments For Score Effects, Home Advantage and Event Count Bias | WAR On Ice: The Blog
Pingback: Predicting Save Percentage: Dangers Zones and Shot Volumes | puck++
Pingback: Breakdown of Price and Hammond (So Far) - Today's Slapshot
Pingback: Examining The Drivers of Score Effects I: Shooting and Save Percentage | puck++